Contact Handle Time | Metric of the Month

  Contact handle time is the average time that an agent spends on an inbound contact, including talk time, chat time, wrap time, and after call or after chat work time (ACW).  For non-live contacts, such as email, voice mail, and faxes, the contact handle time is the average time that an Agent spends working on the contact before escalating or closing out the ticket. Please note that contact handle time is not the same as mean time to resolve (MTTR).  MTTR, sometimes called cycle time, is the average elapsed time from the beginning of an incident or service request, until the ticket associated with the incident or service request is closed out.  So while the total handle time for an incident may be only 10 minutes, unless the ticket is resolved on first contact the MTTR will be longer than the handle time.  In fact, the MTTR can be substantially longer than the handle time depending upon how much after call work is required to resolve the issue, and whether the ticket is escalated to another level of support for resolution.

Why it’s Important
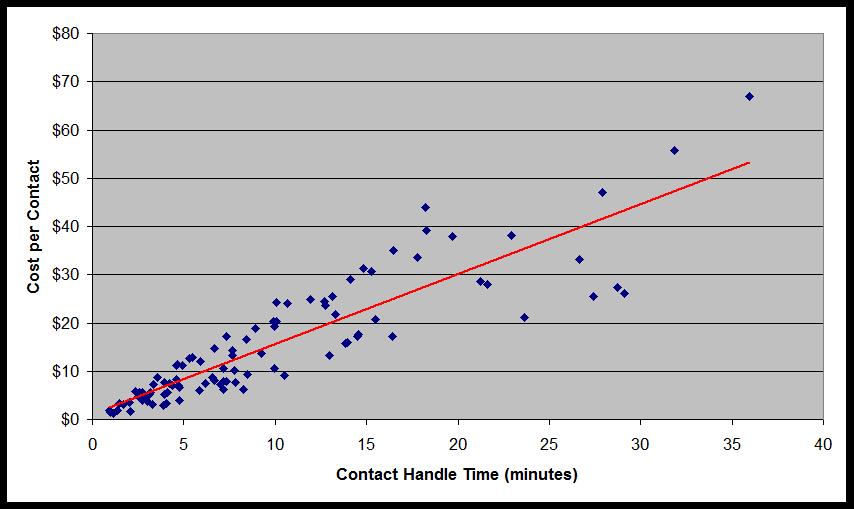
Download This Article Forward To A Friend A contact is the basic unit of work in a service desk.  Contact handle time, therefore, represents the amount of labor required to complete one unit of work.  Additionally it is an indirect measure of contact complexity.  As an example, a typical password reset has a handle time of one to three minutes.  By contrast, a contact for a proprietary business application such as Oracle or SAP may have a handle time of 15 minutes or more. Contact handle time has a direct impact on, and is directly impacted by several other service desk metrics.  One productivity metric that is strongly impacted by handle time is the number of contacts that an agent handles in a month.  For a 10 minute handle time, the average agent handles about 500 contacts per month.  In a more complex environment, where the average handle time is 15 minutes, a typical agent might handle only 300 or so contacts per month.  This, in turn, has headcount implications.  A service desk that takes 5,000 inbound contacts per month with an average handle time of 15 minutes will require more agents than a service desk that takes 5,000 contacts per month with an average handle time of 10 minutes. First contact resolution and first level resolution also have an impact on contact handle time.  In general, handle times increase as the first contact and first level resolution rates increase.  This stands to reason because it is the more difficult/complex contacts that are typically dispatched and/or escalated to higher levels of support, and an increase in FCR and FLR is an indication that the service desk is resolving a more complex set of contacts (read longer  handle times) at level 1. Since contact handle time is a proxy for complexity, service desks with longer handle times generally require more experienced agents.  To continue with our earlier example, an agent that is expected to reset passwords and support basic desktop applications such as Microsoft Office does not need the level of experience or expertise that would be required of an agent that is expected to resolve incidents related to more complex business applications.  This of course has implications for training.  Inasmuch as longer handle times represent more complex incidents, agents supporting these environments require more training and experience to be successful. Perhaps the most significant implication of handle time is the impact it has on cost per contact.  For obvious reasons, cost per contact increases as handle time increases.  Furthermore, this is one of the few linear relationships in IT support.  As such, projecting cost per contact vs. handle time can be done very accurately and is a relatively straightforward exercise.

Benchmark Data for Contact Handle Time

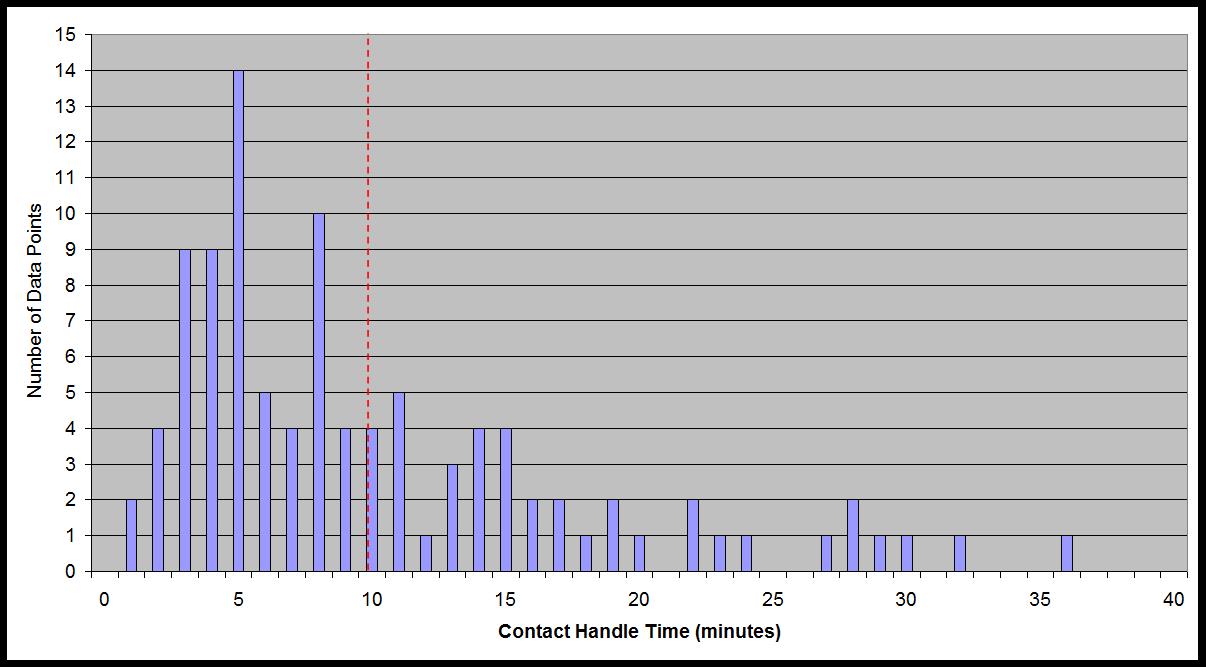
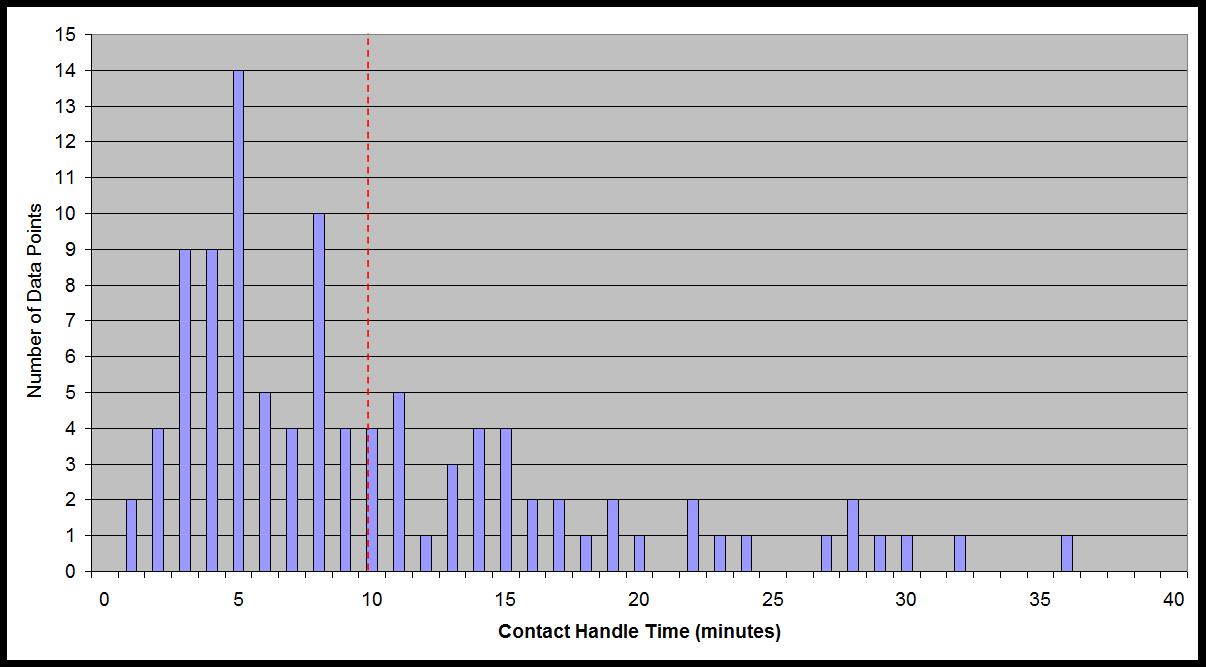
Industry data from MetricNet’s benchmarking database shows that the average contact handle time for all service desks is just under 10 minutes.

Figure 1: Industry Benchmarks for Average Contact Handle Time

Figure 1: Industry Benchmarks for Average Contact Handle Time

Figure 2 below shows the correlation between cost per contact and handle time.  Although the relationship is linear, there is a fairly large variance around the mean (red line).  This is due to differences in wage rates in different geographies, as well as the higher salaries paid to agents in the longer handle time (more complex) environments.

Figure 2: Cost per Contact vs. Contact Handle Time

Figure 2: Cost per Contact vs. Contact Handle Time

Please join us for next month’s Metric of the Month: Agent to Supervisor Ratio, a management span of control metric that has implications for cost and agent effectiveness. Download This Article Forward To A Friend