The Mighty Power of Metrics
Many of us have heard the sage advice “
You can’t manage what you don’t measure.” This is particularly true for Desktop Support, where effective performance measurement is not just a necessity, but a prerequisite for effective management. Despite the widespread belief in this statement, few Desktop Support organizations use KPI’s to their full potential. In fact MetricNet’s research, gathered from literally hundreds of Desktop Support benchmarks, suggests that the vast majority of Desktop Support organizations track very few (if any) performance metrics. And the KPI’s they
do follow are used to merely track and trend their Desktop Support performance – but nothing more! Unfortunately, in this mode, one misses the real value of performance measurement by failing to exploit the
diagnostic capabilities of KPI’s.
The true potential of KPI’s for Desktop Support can only be realized when they are used holistically, not just to
measure performance, but also to:
- Track and trend performance over time
- Benchmark performance vs. industry peers
- Identify strengths and weaknesses in Desktop Support
- Diagnose and understand the underlying drivers of performance gaps
- Establish performance goals for the organization
- Prescribe actions to improve results, and achieve World-Class Performance!
In short, performance measurement and management is a critical discipline that must be mastered for any Desktop Support Organization that aspires to World-Class performance.
The Eight Essential Metrics for Desktop Support
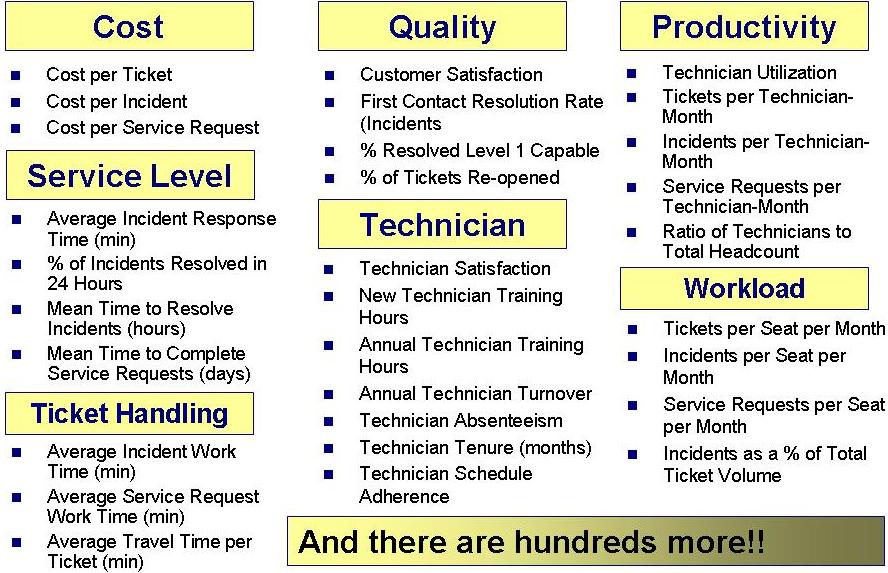
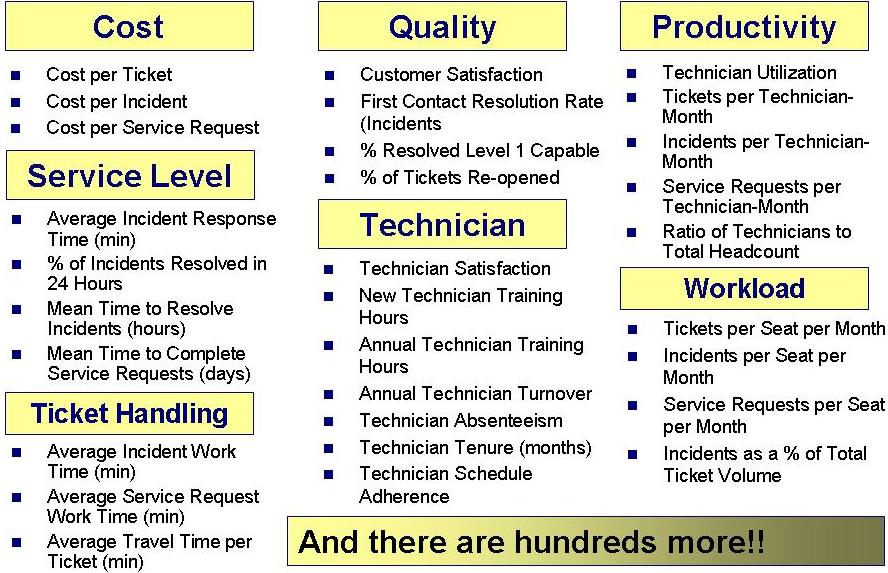
The average Desktop Support organization tracks fewer than 5 KPI’s. However, there are literally hundreds of KPI’s that have been defined for Desktop Support. A list of the most common Desktop Support KPI’s is shown in Figure 1 below. The vast majority of these metrics, however, are only marginally relevant – at best!
Figure 1: The Most Common Desktop Support KPI’s
When it comes to KPI’s for Desktop Support, less is more! The eight that really matter are as follows:
- Cost per Ticket
- Customer Satisfaction
- Technician Utilization
- First Contact Resolution Rate (incidents)
- Mean Time to Resolve
- Resolved Level 1 Capable
- Technician Satisfaction
- Balanced Scorecard
These eight metrics represent the 80/20 rule when it comes to Desktop Support: 80% of the value you receive from performance measurement and management in Desktop Support can be derived from these eight simple metrics!
Tickets, Incidents, and Service Requests
Before we go any further, it is worth defining a few terms. Specifically, we need to define the terms Ticket, Incident, and Service Request as they relate to Desktop Support.
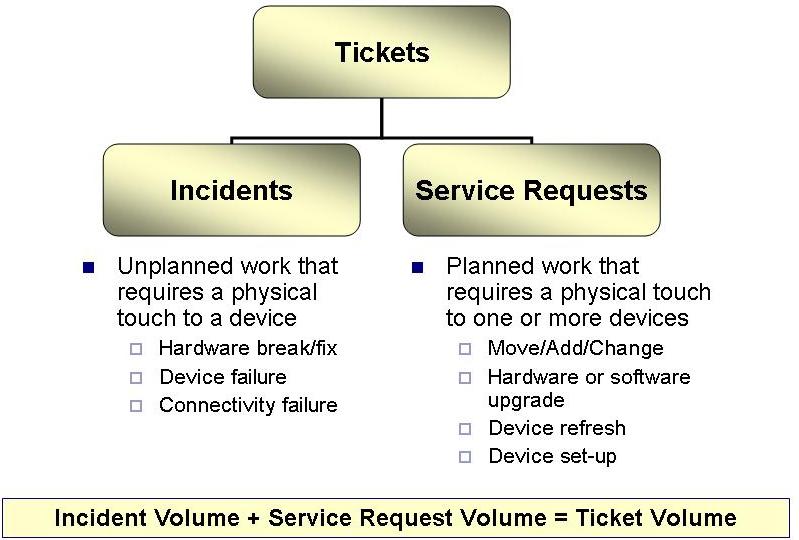
An Incident is typically unplanned work that requires the assistance of an on-site technician to resolve. Common examples include a desktop or laptop computer break/fix, a printer or server failure, connectivity problems, or any other issue that cannot be resolved remotely by the Level 1 Service Desk. By contrast, most Service Requests represent planned work. Among the most common Service Requests are Move’s/Add’s/Change’s, hardware refresh/replacement, and device upgrades. Tickets represent the sum of all Incidents and Service Requests. Figure 2 below illustrates these definitions.
Figure 2: Tickets, Incidents and Service Requests
The Eight Desktop KPI’s Defined
How do we know that the eight KPI’s listed above are the most important? Is it a hunch? Suspicion? An academic exercise? No, it’s none of the above. We know that these are the eight metrics that matter most because the empirical evidence from hundreds of Desktop Support benchmarks supports this conclusion. But let us explain
why these metrics are so critically important.
One goal of every business is to achieve the highest possible quality at the lowest possible cost. It stands to reason, therefore, that cost and quality should be measured on an ongoing basis. In fact, I would argue that cost and quality are the only two things that really matter. In Desktop Support, the most effective cost metric is Cost per Ticket, and the best indicator of quality is Customer Satisfaction. With this premise in mind, it’s relatively easy to come up with the next four metrics on our list: Technician Utilization, First Contact Resolution (FCR) for incidents, Mean Time to Resolve (MTTR), and Technician Satisfaction.
Earlier in this article, we mentioned the importance of using metrics as a diagnostic tool to improve performance. So we have to ask ourselves, if customer satisfaction is one of the “foundation metrics” in Desktop Support, how can we affect it? How can we improve it? Put another way, if customer satisfaction is suffering, what is the diagnosis?
Well, it turns out that customer satisfaction is affected by a whole range of other performance variables, including Average Response Time, and Average Work Time per Ticket, to name just a few. But the three biggest drivers of customer satisfaction – by far – are First Contact Resolution (FCR), Mean Time to Resolve (MTTR), and Technician Satisfaction.
Nine times out of ten when customer satisfaction needs to improve, this can be achieved by increasing FCR and Technician Satisfaction, and decreasing the MTTR. This is why World-Class Desktop Support organizations focus so much on these metrics. They engage in a variety of
tactics to continuously improve these metrics, including technician training, effective workforce management/scheduling, and technician incentives tied to improvements in FCR and MTTR.
But what about Cost per Ticket, the other foundation metric in the Desktop Support? It is common knowledge that labor, i.e. personnel, is the single biggest expense in Desktop Support. In fact, for the average Desktop Support organization, 74% of all costs are labor related: salaries, benefits, incentive pay, and contractors. By definition, then, labor costs are the greatest lever we have to manage the Cost per Ticket.
The best measure of labor efficiency is Technician Utilization. Because labor costs represent the overwhelming majority of Desktop Support operating expense, if Technician Utilization is high, the Cost per Ticket will inevitably be low. Conversely, when Technician Utilization is low, labor costs, and hence Cost per Ticket, will be high.
The next KPI on the list of “must have’s” is % Resolved Level 1 Capable. This metric is a proxy for Total Cost of Ownership (TCO), and is a critical measure of overall End-User Support effectiveness. Without this metric, it is very possible for both the Desktop and Level 1 Service Desk to achieve a low Cost per Ticket, and hence appear to be very efficient, but in fact be driving a very high TCO. Specifically, if Desktop Support is achieving a low Cost per Ticket by handling a significant number of contacts that could/should have been resolved at Level 1, this will dramatically increase end-user support TCO.
The average value for this metric worldwide is more than 20%. That is, more than 20% of all tickets resolved at Desktop Support could have been resolved at Level 1! This is a stunning observation, and represents an opportunity to dramatically reduce the cost of Level 2 Desktop Support, and the total cost of end-user support (TCO) for most organizations.
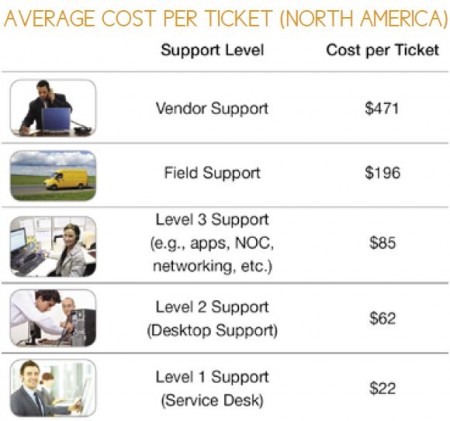
Figures 3 illustrates this concept, and shows how the cost of resolution increases dramatically as the point of resolution moves further away from the Level 1 Service Desk
Figure 3: Cost per Ticket vs. Resolution Level (North American Averages)
The next metric, Technician Satisfaction, is strongly correlated with many other metrics in Desktop Support. High levels of Technician Satisfaction lead to lower turnover, lower absenteeism, lower work times, and higher First Contact Resolution Rates. These, in turn, result in lower Cost per Ticket, and higher Customer Satisfaction.
Progressive Desktop Support organizations therefore measure Technician Satisfaction at least twice per year, and take steps to ensure that they are maintaining high levels of Technician Satisfaction. Specifically, World-Class Desktop Support organizations provide training, career pathing, and coaching for their agents at well above industry average levels. This, in turn, leads to high levels of Technician Satisfaction and morale.
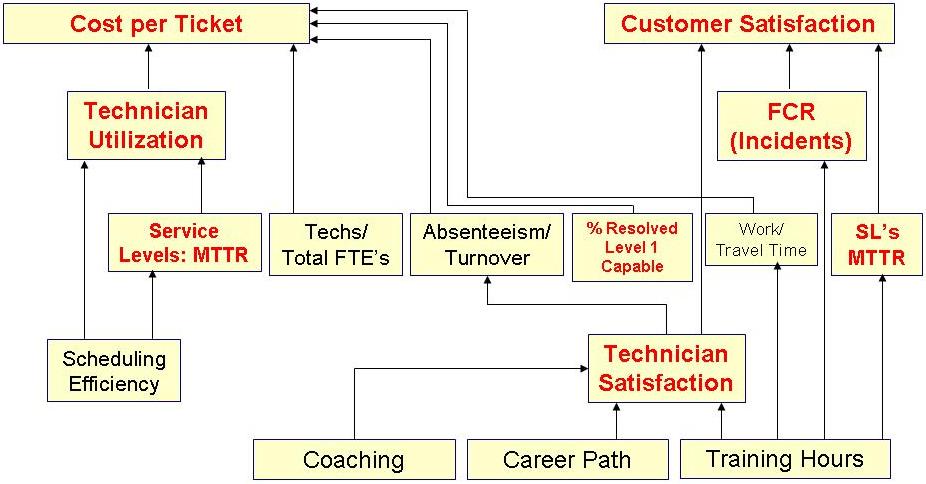
Understanding the interrelationships of the key Desktop Support KPI’s is important, for it provides a roadmap for managing and affecting change in the organization. If your Cost per Ticket is too high, for example, the first place to turn for a remedy is Technician Utilization. Likewise, to improve Customer Satisfaction, the metrics that will affect the desired change include FCR, Technician Satisfaction, and MTTR.
The cause-and-effect relationships of the Desktop Support KPI’s we have discussed so far are illustrated in Figure 4 below. The KPI’s in red are the ones on our short list of “must have” Key Performance Indicators for Desktop Support.
Figure 4: Cause-and-Effect of Desktop Support KPI’s
Understanding the interrelationships of the key Desktop Support KPI’s is important, for it provides a roadmap for managing and affecting change in the organization. If your Cost per Ticket is too high, for example, the first place to turn for a remedy is Technician Utilization. Likewise, to improve Customer Satisfaction, the metrics that will affect the desired change include FCR, Technician Satisfaction, and MTTR.
We have now discussed seven of the eight metrics that are most important for managing Desktop Support. What about the eighth metric? What is the Balanced Scorecard, and how do we create one? Can a single measure really tell us the overall performance of our Desktop Support organization? The answer is yes, and we do this by aggregating a number of measures to come up with a combined, overall score for Desktop Support.
MetricNet’s research shows that establishing a single, overall score for your Desktop Support organization is critical. We call this measure the Balanced Score because it truly does communicate a balanced picture of Desktop Support performance. The scorecard is a mechanism that utilizes the key metrics tracked by Desktop Support such as Cost per Ticket, Customer Satisfaction, and Mean Time to Resolve, and aggregates them into a single, all-inclusive measure of Desktop Support performance. Due to space limitations, we are unable go into detail on how to create a scorecard in this article. However, the mechanics of creating a Desktop Support Balanced Scorecard will be addressed in a subsequent article by MetricNet.
Conclusion
Most Desktop Support organizations commit two major mistakes when it comes to performance measurement: 1) they do not track the right KPI’s, and 2) they do not exploit the full potential of Desktop Support KPI’s as a diagnostic tool.
In this article we have shown that you can effectively track and trend your Desktop Support performance using just eight KPI’s. The two “foundation metrics” that every Desktop Support organization should track on an ongoing basis are Cost per Ticket and Customer Satisfaction. The next three metrics in the top eight are the ones that have the greatest influence on cost and customer satisfaction: Technician Utilization, Incident First Contact Resolution, and Mean Time to Resolve. Then we suggest tracking % Resolved Level 1 Capable because it is a proxy for Total Cost of Ownership, and is an overall indicator of Desktop Support efficiency. The seventh metric on our list, Technician Satisfaction, is important because it is so strongly correlated with a number of important metrics in Desktop Support, including Cost per Ticket and Customer Satisfaction. And the final metric, the Balanced Scorecard, provides an overall measure of Desktop Support performance.
When it comes performance measurement for Desktop Support, less really is more! By tracking just eight KPI’s, and using these KPI’s diagnostically to affect positive change in your organization, the job of guiding your Desktop Support towards World-Class performance can be greatly simplified.