Why it’s Important
Cost per Ticket, along with Customer Satisfaction, are often referred to as the
foundation metrics in desktop support. They are the two most important metrics because ultimately everything boils down to cost containment (as measured by Cost per Ticket), and quality of service (as measured by customer satisfaction).
In any service delivery organization, cost, or more accurately unit cost, is critically important. Cost per Ticket is a measure of how
efficiently Desktop Support conducts its business. A higher than average Cost per Ticket is not necessarily a bad thing, particularly if accompanied by higher than average quality levels. Conversely, a low Cost per Ticket is not necessarily good, particularly if the low cost is achieved by sacrificing quality of service. Every Desktop Support organization should track and trend Cost per Ticket on a monthly basis.
Deconstructing Cost per Ticket
Desktop Support Tickets are comprised of incidents and service requests, as shown in Figure 2 below. Just as Cost per Contact gives us the unit cost for the level 1 service desk, Cost per Ticket, Cost per Incident and Cost per Service Request give us the unit costs for desktop support.
Figure 2: Tickets, Incidents and Service Requests
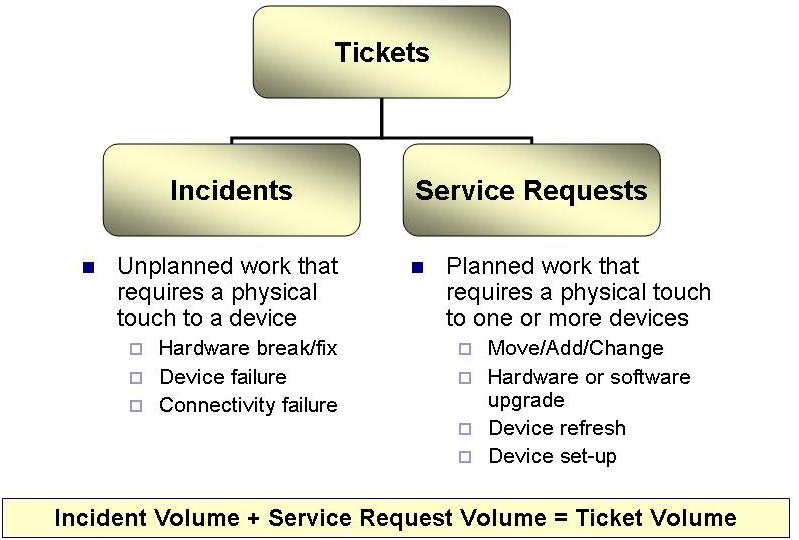
In general, incidents require less time to resolve than service requests, so the Cost per Incident is almost always less than the Cost per Service Request. Since the Cost per Ticket is a weighted average of the Cost per Incident and the Cost per Service Request, the mix of incidents and service requests will strongly influence the Cost per Ticket.
Let’s assume, for example, that at Company ABC the Cost per Incident is $50, while the Cost per Service Request is $100. Additionally, 75% of ABC’s tickets are incidents, while the remaining 25% of tickets are service requests. The Cost per Ticket can be calculated based upon a weighted average as follows: Cost per Ticket = ($50 X 75%) + ($100 X 25%) = $62.50.
Now let’s take the example of Company XYZ who has the same Cost per Incident and Cost per Service Request as Company ABC, but whose mix of incidents and service requests is very different. Specifically, at XYZ only 40% of tickets are incidents, while the remaining 60% of tickets are service requests. The weighted average Cost per Ticket for XYZ can be calculated as follows: Cost per Ticket = ($50 X 40%) + ($100 X 60%) = $80.00.
So although ABC and XYZ have the exact same Cost per Incident and Cost per Service Request, their unique mix of incidents and service requests yields a very different Cost per Ticket. If both organizations were to handle 5,000 tickets per month, Company XYZ would spend $87,500 more per month on desktop support than Company ABC, simply because a larger percentage of their tickets are service requests!
Another key factor that influences the cost per ticket is the user population density. Desktop support technicians working in a high density user environment (e.g., a high-rise office building with lots of cubicles) are able to handle a larger volume of tickets per month than a technician supporting a work environment spread across a vast geographical area (think desktop support for a retail bank with hundreds of branches across the country).
Benchmarking Ranges for Cost per Ticket
The North American averages and ranges for Cost per Ticket, Cost per Incident, and Cost per Service Request in 2010 are shown below, in Figure 3.
Figure 3: North American Desktop Support Costs

The ranges on these metrics (min to max) are enormous, varying by more than an order of magnitude (10X) from min to max. The reasons for this were outlined above, and include the user population density, and the unique mix of incidents and service requests.
Please join us for next month’s
Metric of the Month:
Level 1 Resolution Rate, a service desk metric, sometimes confused with
First Contact Resolution Rate, which provides important insights into Total Cost of Ownership (TCO) for end-user support.