Tickets per Technician per Month | MetricNet


Tickets per Technician per Month is a Desktop Support metric.  As the name suggests, Tickets per Technician per Month is simply the total number of monthly tickets logged by desktop support divided by the number of technicians working in desktop support.

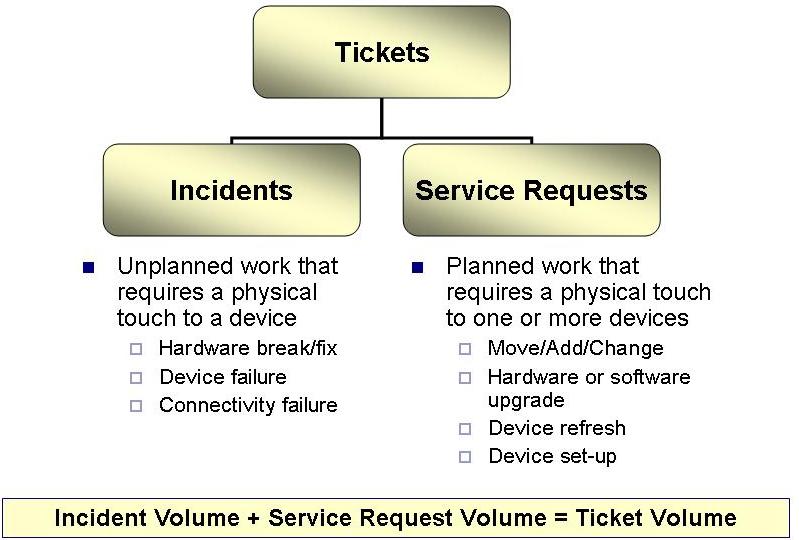
For purposes of this discussion it is important to remember that desktop support tickets are comprised of both incidents and service requests.  An Incident is typically unplanned work that requires the assistance of an on-site technician to resolve.  Common examples include a desktop or laptop computer break/fix, a printer or server failure, connectivity problems, or any other issue that cannot be resolved remotely by the Level 1 Service Desk.  By contrast, most Service Requests represent planned work.  Among the most common Service Requests are Move’s/Add’s/Change’s, hardware refresh/replacement, and device upgrades.  Tickets represent the sum of all Incidents and Service Requests, as illustrated in Figure 1 below.

Figure 1:  Tickets, Incidents and Service Requests
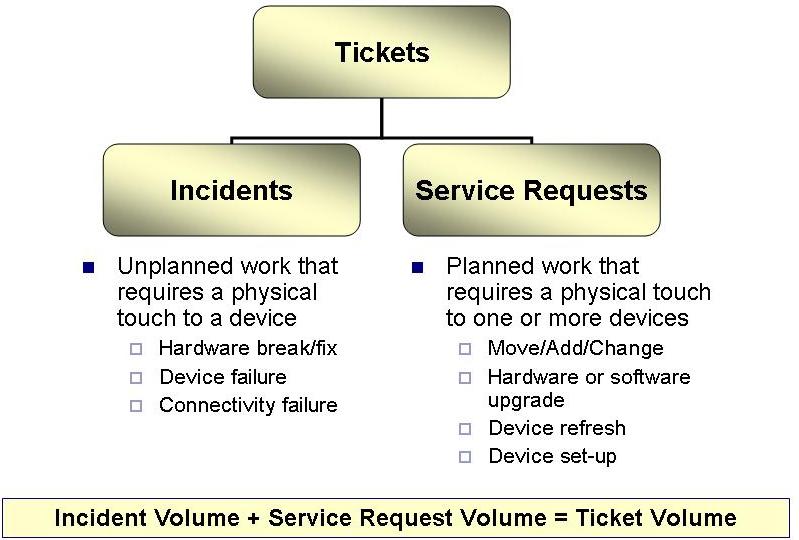
Figure 1 Tickets, Incidents and Service Requests

Why it’s Important

Tickets are the primary unit of work in desktop support.  As such, ticket volume will drive the headcount of technicians needed by an organization.  A common misperception in desktop support is that the user population alone will define the number of technicians needed.  This approach wrongly assumes that the ratio of desktop support technicians to the number of users is fixed.  For example, 12.5 desktop support technicians are needed for every 1,000 users.  The error in this approach is that no two user populations have the same needs, and therefore no two user populations generate the same workload.  As such, staffing decisions in desktop support should be based upon workload, not user population.  With this in mind, it is easy to see why two organizations with exactly the same headcount may require very different staffing levels for desktop support.
Download This Article Forward To A Friend

Benchmark Data for Tickets per Technician per Month

The number of tickets that can be handled by a technician is driven by numerous factors including the mix of incidents and service requests, the average work time per ticket, and the average travel time per ticket.  Service requests generally take more time to complete than incidents, so for organizations with a higher percentage of service requests vs. incidents the number of tickets that a technician can handle in a month will be lower.  Likewise, as the work time per ticket increases, the number of tickets that a technician can handle in a month will decrease.  And finally, in a high density user environment (think high rise office building) the travel time per ticket will be low, and this, in turn, increases the number of tickets a technician can handle in a month.

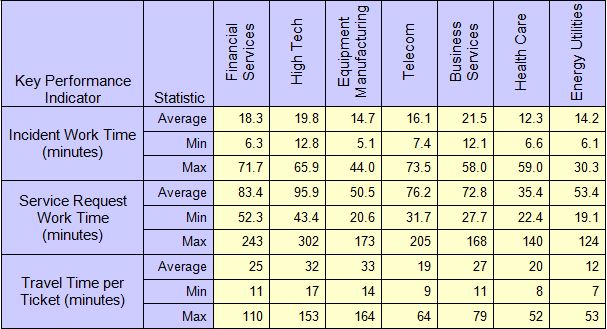
Figure 1 below shows just how dramatically the travel time, and work times for incidents and service requests can vary from one environment to another.  These wide variations produce correspondingly wide ranges in the volume of tickets that a technician can handle in a month.

Figure 1: Desktop Support Work Time and Travel Time

Figure 1 Desktop Support Work Time and Travel Time

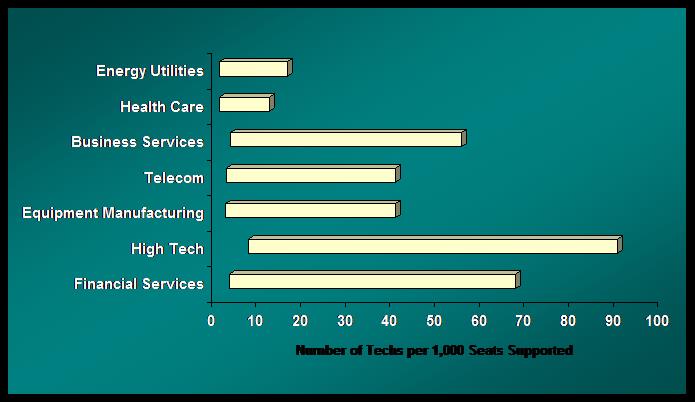
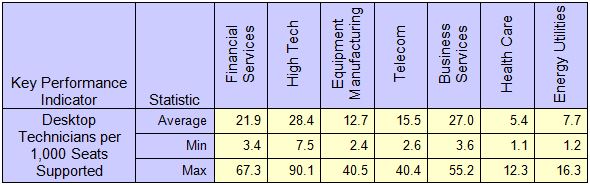
Since ticket work and travel time drives technician headcount, one would also expect to see a wide variation in headcount requirements from company to company, and from industry to industry.  Figures 2 below shows that the average desktop technician headcount can range from a low of just 5.4 technicians per 1,000 seats in health care, to a high of 28.4 technicians per 1,000 seats in the high tech industry.

Figure 2: Desktop Support Technician Headcount Ranges by Industry

Figure 2 Desktop Support Technician Headcount Ranges by Industry

Figure 2 Desktop Support Technician Headcount Ranges by Industry2


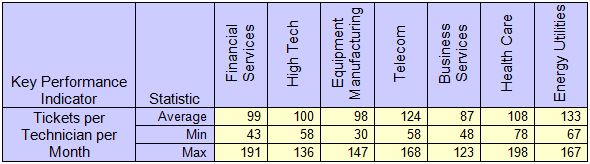
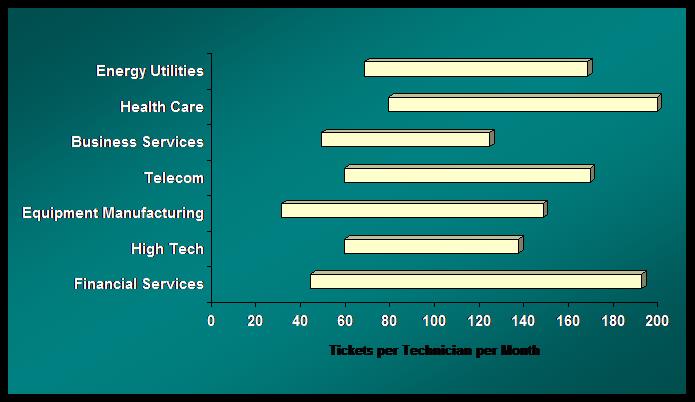
Finally, when we look at the benchmarking data for the number of Tickets per Technician per month in Figure 3, we see a wide range of values, from a low of 30 Tickets per Technician per Month, to a high of 198 Tickets per Technician per Month.  These wide variations are once again driven by differences in travel time and work time per ticket, which are in turn a function of the unique environment in which each technician operates.

Figure 3: Tickets per Technician per Month by Industry

Figure 3 Tickets per Technician per Month by Industry

Figure 3 Tickets per Technician per Month by Industry2

 
  Please join us for next month’s Metric of the Month: Annual Agent Turnover, a service desk metric that has implications for quality of service and agent experience levels. Download This Article Forward To A Friend