First Level Resolution Defined
In its simplest form, First Level Resolution is a measure of a service desk’s ability to resolve tickets at Level 1, without having to escalate the ticket to Level 2 (Desktop Support), Level 3 (internal IT professionals in applications, networking, the data center, or elsewhere), Field Support, or vendor support. First Level Resolution is not to be confused with its close cousin,
First Contact Resolution. Let me provide an example to illustrate the difference.
Take the situation where a Level 1 agent accepts a call, logs a ticket, but fails to provide a solution to the caller on the initial contact. But rather than escalate the ticket, the Level 1 agent researches the user’s issue, identifies an appropriate solution, calls the user back, delivers the solution, and closes out the ticket. Although the ticket was not resolved on first contact, it
was resolved at Level 1. Now let’s take the situation where the Level 1 agent accepts a call, logs a ticket, and warm transfers the caller to a Level 3 IT professional who works in the NOC. The Level 3 professional takes over the call, and provides a solution for the ticket before the user hangs up. This ticket
was resolved on First Contact, but
was not resolved at First Level.
It is also helpful to note that First
Contact Resolution is a quality metric. It strongly impacts Customer Satisfaction. First
Level Resolution, by contrast, is a cost metric that strongly influences Total Cost of Ownership for end-user support.
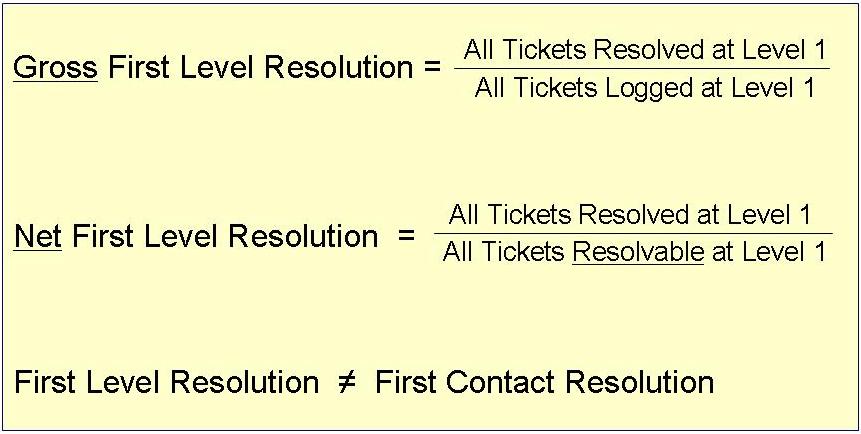
To have a meaningful discussion of FLR, we have to make a further distinction between Gross First Level Resolution, and Net First Level Resolution. Gross FLR is the ratio of All Tickets
Resolved at Level 1, to all Tickets
Logged at Level 1. Net FLR, by contrast, is the ratio of All Tickets Resolved at Level 1 to All Tickets that can
potentially be resolved at Level 1. Figure 1 illustrates the difference between Gross FLR, and Net FLR.
Gross FLR is self-explanatory. It is a simple ratio that is very intuitive to most people. However, to fully appreciate Net FLR, it is necessary to define a “carve-out”: A carve-out is a ticket type that for one reason or another cannot be resolved at Level 1. A carve-out can be the result of a physical limitation (it is physically impossible to replace a hardware component remotely, at Level 1, for example), or it might be the result of policy or security restrictions placed on Level 1 support, such as when Level 1 is not granted access rights to certain systems. The denominator of the Net FLR ratio is equal to the number of tickets logged at Level 1,
minus the number of carve-outs.
Net FLR is by far the more important of the two metrics, for it measures the true effectiveness of the Level 1 Service Desk to resolve tickets within their purview of defined responsibility.
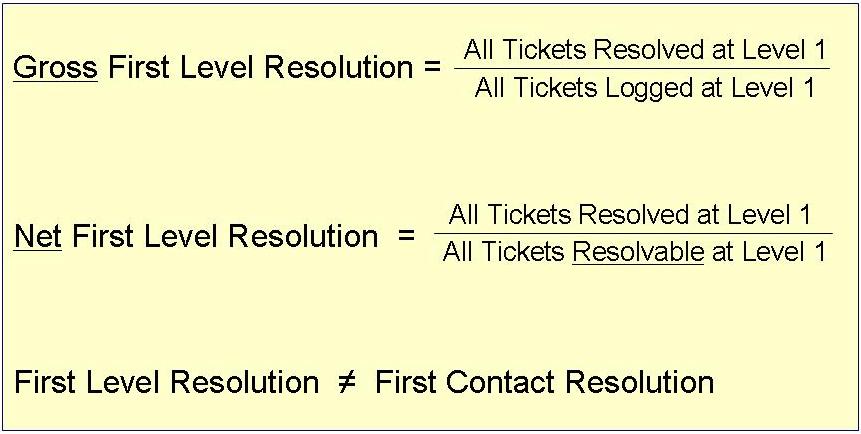
Figure 1
MetricNet’s benchmarking database, compiled from more than 1,400 service desk benchmarks worldwide, shows that Net FLR can range from as low at 24% to as high as 99%. At one end of the spectrum (24% Net FLR), you have the “bag-and-tag” or “log-and-dispatch” service desks that add very little value, and escalate the majority of tickets to other, more costly, levels of support. At the opposite end of the spectrum (99% Net FLR) you have World-Class service desks that escalate very few tickets. These service desks save their organizations hundreds of thousands, or even millions of dollars per year by minimizing end-user TCO.
First Level Resolution and Total Cost of Ownership
Figure 2 illustrates the Cost per Ticket for resolution at different support levels. This data represents North American averages, and is a fully loaded cost, including agent salaries and benefits, salaries and benefits for indirect personnel (e.g., trainers and workforce schedulers), facilities expense (rent, lease, or depreciation for the occupied facilities), insurance, telecom, desktop technology (licensing fees, desktop/laptop computers, etc.), travel, training, and office supplies. Clearly, as a ticket is escalated, and resolution moves further away from the Level 1 service desk, the cost of resolution increases. Furthermore, these costs are cumulative. If a ticket is logged at Level 1, and then escalated to Level 2 (Desktop Support) for resolution, the average cost of resolution is not just $62, but $62
plus $22, for a total of $84.
The cost of resolution increases at each successive level for a number of reasons, including longer handle times, and higher salaries beyond Level 1. So, for example, a ticket that might be resolved in 10 minutes at Level 1, could take 30 minutes or more to resolve at Level 2 because it requires a visit to the site of the user. The same ticket, when resolved at Level 3, involves personnel that are more highly paid than Level 1 agents, and who are (frankly) slower to resolve tickets because they are not full-time support professionals. The clear implication is that
any ticket that can be resolved at Level 1, should be resolved at Level 1.
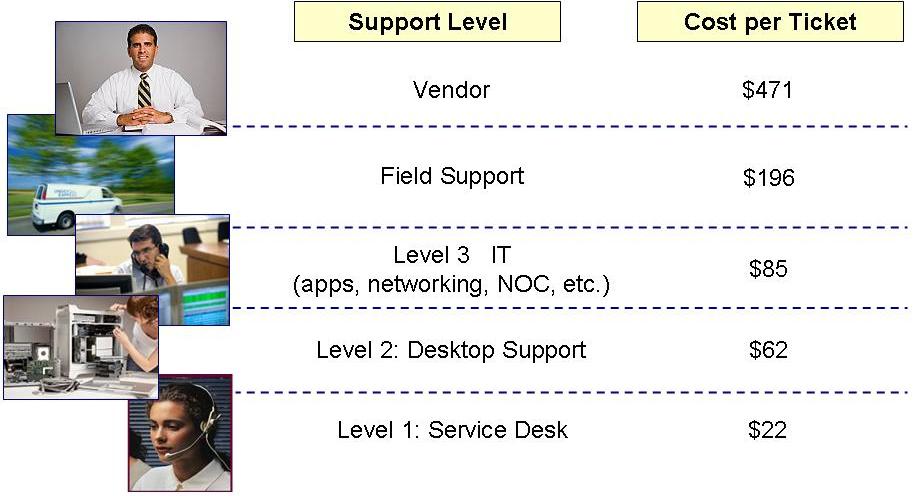 Figure 2
First Level Resolution: A Case Study
For our case study, we are going to use a typical Level 1 service desk that handles 10,000 inbound contacts per month, and logs 8,000 tickets per month. Why is the ticket volume less than the contact volume? Because not every contact results in a ticket. Some contacts, for example, are mere status checks from end-users inquiring about the status of an existing ticket. And in some cases, a single ticket may be the result of 100 or more contacts, such as when many users call the service desk to report a network outage.
These 8,000 tickets are categorized as shown in Figure 3 into 5,000 incidents and 3,000 service requests. The distinction between the two is that Incidents are generally unplanned, and are more urgent than Service Requests. Incidents include such things as failure to boot, a broken or stolen device, a software “how to” question, or a password reset. A Service Request, by contrast, is generally planned work, and is often less urgent than an Incident. Service Requests include such things as a device refresh or replacement, a move/add/change, or a software upgrade. Incidents are generally (but not always) resolvable at Level 1. Service Requests are generally (but not always) resolved by Level 2 Desktop Support. The ticket volume is the sum of all Incidents and Service Requests.
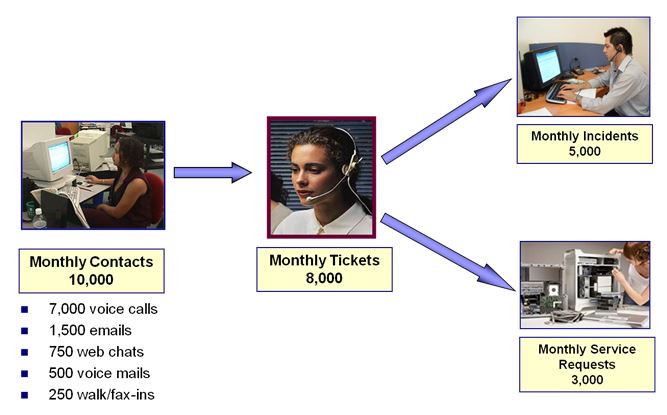 Figure 3
To continue with our example, lets further assume that the 5,000 Incidents and 3,000 Service Requests can be broken down as shown in Figure 4. Our monthly Incident volume is comprised of 2,250 password resets, 1,500 software “how to’s”, 600 VPN connectivity issues, 150 application failures, and 500 hardware failures. Based on the monthly ticket volume and the average Cost per Ticket at Level 1 from Figure 2 above, we can also estimate the annual operating cost for this service desk at $2.11 million per year.
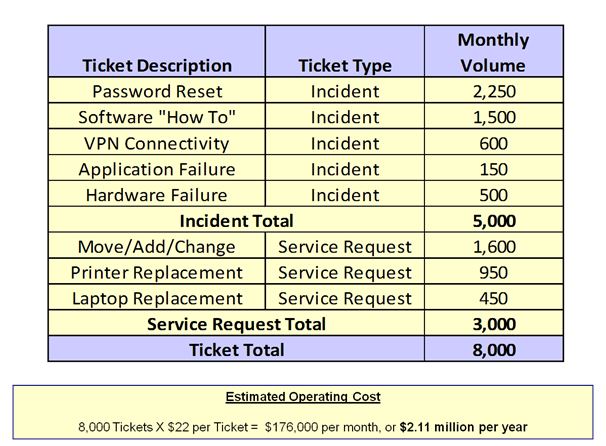
Figure 4
Let’s further assume that the resolution of the 8,00 tickets per month is distributed among the different support levels as shown in Figure 5. Most of the password resets are resolved at Level 1, while none of the hardware failures or MAC’s (move/add/changes) are being resolved at Level 1. This is nothing surprising; we would expect most password resets to be resolved at Level 1, while we don’t expect any of the MAC’s or hardware failures to be resolved at Level 1.
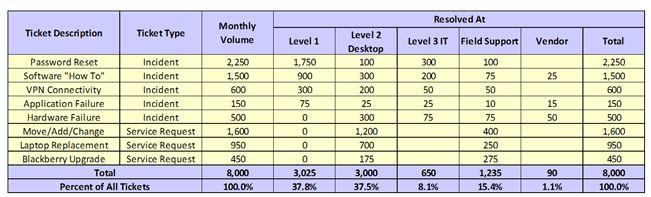
Figure 5
With this data, we can now calculate the
Gross First Level Resolution. Figure 6 shows this calculation. Recall that the numerator for this ratio is the number of tickets
resolved at Level 1, while the denominator is the number of tickets
logged at Level 1. As you can see, the Gross FLR is 37.8%. Is this good or bad? Well, it’s neither. Gross FLR is influenced by numerous factors that are beyond the control of the Level 1 Service Desk. These factors include the number of hardware failures, MAC’s, the age of the infrastructure, and a host of other factors. Remember, Net FLR is the metric that we really care about, because that’s the metric that tells us how effective the Level 1 service desk is performing.
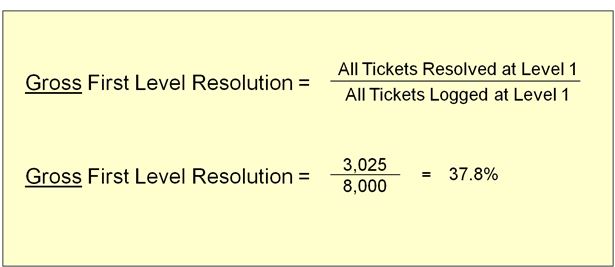
Figure 6
Since Net FLR is the number we really care about, we need to calculate that metric. Figure 7 shows the number of tickets that were actually resolved at Level 1, as well as the number of tickets that could have
potentially been resolved at Level 1. Of 2,250 password resets logged at Level 1, it is estimated that all were resolvable at Level 1. But only 1,750 password resets were actually resolved at Level 1. For password resets then, there were 500 “escalation defects”: tickets that should have been resolved at Level 1, but were not. The same basic logic applies to all ticket types. We simply look at the number of tickets resolved at Level 1, vs. the number that
could have been resolved at Level 1, and then calculate the number of escalation defects for each ticket type. When summed up, the total number of escalation defects for this service desk is 1,350 per month. That’s 1,350 tickets that were escalated beyond Level 1 that should have been resolved at Level 1!
We now have the data we need to calculate the Net FLR. The numerator of the Net FLR ratio is 3,025 tickets. This is the number of tickets actually resolved at Level 1. The denominator of the ratio is the number of tickets that could potentially have been resolved at Level 1. We see from Figure 7 that this number is 4,375 tickets. This yields a Net FLR of 69.1% as shown in Figure 8. From the original 8,000 tickets, we have 3,625 carve-outs. These are tickets that cannot be resolved at Level 1, so they are carved out of the denominator before calculating Net FLR.
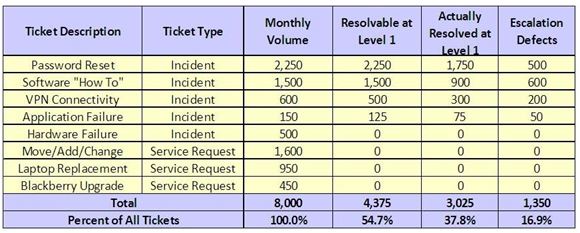 Figure 7
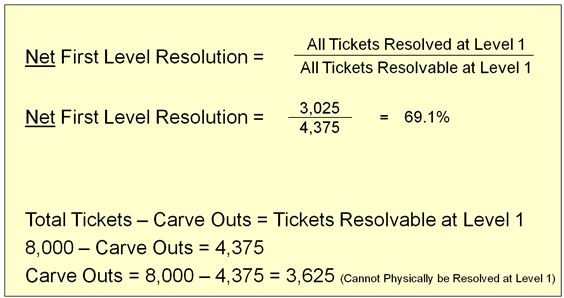
Figure 8
Once again, the obvious question: how good is 69.1% Net FLR? To answer the question, in Figure 9 we have plotted the Net FLR metric for more than 1,400 service desks worldwide. The average Net FLR is 73.9%, but ranges from 24% to 98.9%. The 69.1% Net FLR from our example is therefore below average.
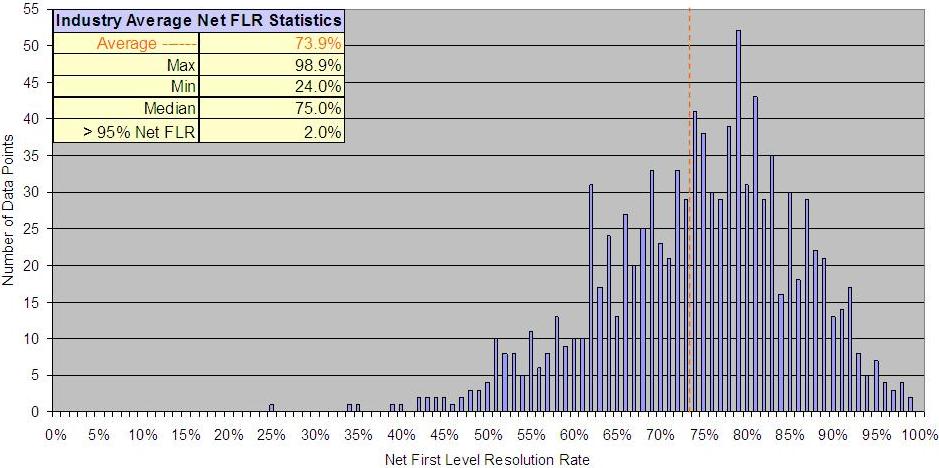 Figure 9
Remember, maximizing Net FLR is the equivalent of minimizing TCO. So it stands to reason that we should be able to calculate how much the escalation defects are adding to our end-user TCO. The data from Figure 7 gives us the ability to calculate the cost of escalation defects. Since the cost of ticket resolution is cumulative, the cost of defects at any given resolution level is simply the number of defects escalated to that level, multiplied by the cost of resolution at that level. One might be led to believe that because the Net FLR for this service desk is just a little below average (69.1% vs. an industry average Net FLR of 73.9%) the cost of defects is probably nothing to worry about. Let’s test that assumption.
In Figure 10, we have summed up the number of defects at each level, and multiplied them by the cost of resolution at each level. The stunning result is that the escalation defects for this service desk are adding a whopping $1.7 million per year to end-user TCO. For a service desk with an operating budget of just $2.1 million per year (Figure 4 above), this is an enormous amount. It represents 81% of the annual operating budget for Level 1 support! Could you imagine building a car for $15,000, and then adding another $12,000 to the cost of manufacture due to defects in workmanship? Obviously the cost of defects for this service desk
is something to worry about!
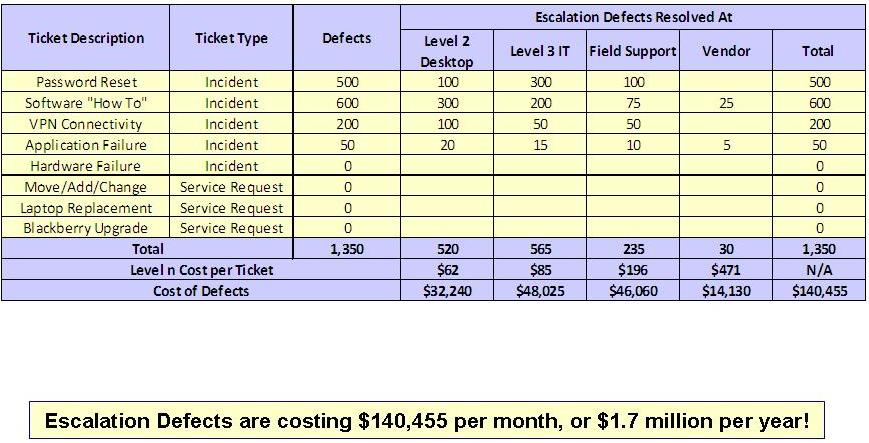 Figure 10
The Upshot: Maximizing Net FLR
Hopefully you are now convinced that Net FLR is an important metric, and that every effort should be made to maximize this number. So how do we go about doing that? There are four specific recommendations that can be implemented to increase, and ultimately maximize FLR:
- Ensure that agents at Level 1 are adequately trained to maximize Net FLR
- Adopt and implement a remote diagnostic tool at Level 1
- Develop and maintain a knowledgebase at the Level 1 service desk
- Establish a performance goal for Net FLR
First Level Resolution is largely about empowerment. It is about equipping your Level 1 agents with the tools and training necessary to achieve a high First Level Resolution Rate. Perhaps it is cliché to state that more and better agent training can lead to higher Level 1 resolution rates, but the evidence to support this assertion is irrefutable. Figure 11 shows the impact of new agent training hours on Net FLR, while Figure 12 shows the impact of annual training hours on Net FLR. The blue diamonds on these charts represent individual data points, while the red line represents the linear regression of the data.
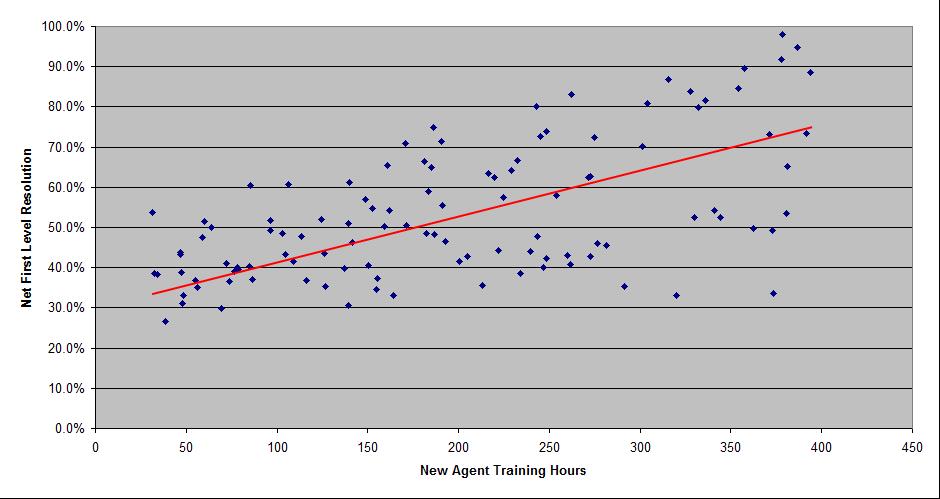 Figure 11
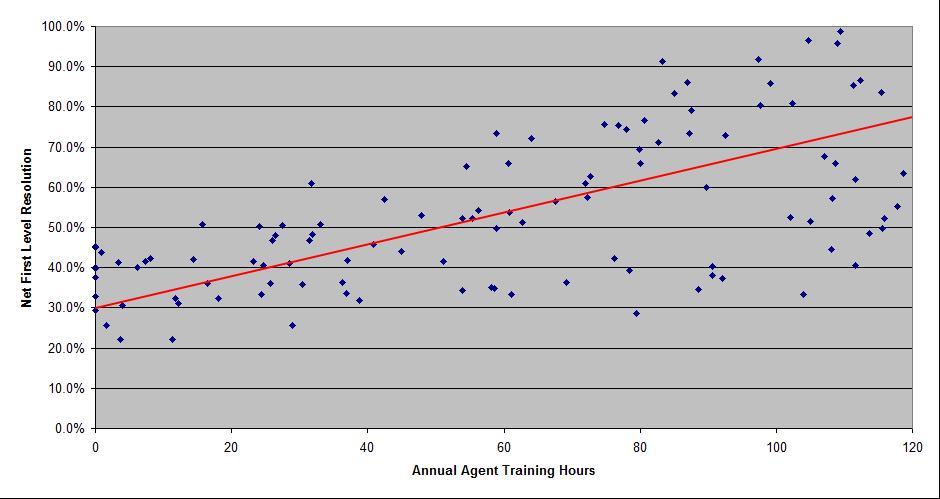 Figure 12
The second tried and tested method for improving First Level Resolution is through the adoption of a good remote diagnostic tool that enables Level 1 agents to remotely proxy into a user’s desktop or laptop computer to conduct diagnostics and troubleshooting. Until recently, these tools were quite expensive, which made it difficult for smaller service desks to justify the investment. However, the cost of these tools has come down substantially, and there is at least one service that requires no up-front investment in infrastructure, yet delivers all the advantages of a remote diagnostic tool by hosting the application remotely and delivering the functionality as a service (SaaS). The power of these tools is evident in Figure 13, which shows the Net FLR for Level 1 service desks with and without remote diagnostic tools. As you can see, the average Net FLR is significantly higher for service desks that employ remote diagnostic capability vs. those that do not (77.8% vs. 61.4% Net FLR).
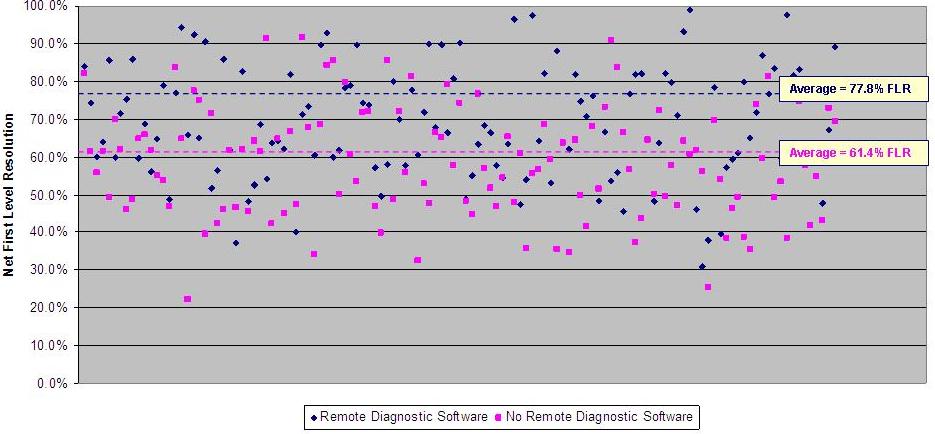 Figure 13
Effective Knowledge Management can also have a dramatic impact on an agent’s ability to resolve tickets at Level 1. A good knowledge base is, unfortunately, one of those tools that can be quite costly to implement and maintain. For smaller service desks (< 10 agents), it is unrealistic to have anything but a rudimentary knowledge management tool. For these desks, the investment is simply to high to justify a full-blown knowledge management discipline. There are, however, knowledge packs, and other off-the-shelf knowledge management products that can and should be implemented, even by smaller desks.
For larger desks that can justify the time and expense required to maintain a comprehensive knowledgebase, the benefits are numerous. In addition to higher First
Level Resolution Rates, a comprehensive knowledgebase will yield higher First
Contact Resolution Rates, lower handle times, and higher customer satisfaction.
Unlike a remote diagnostic tool which you either have, or do not have, effective knowledge management requires a maturing process that can take months, or even years. MetricNet ranks the maturity of knowledge management systems on a scale of 1 to 5, where 1 indicates no knowledge management capability, and 5 represents World-Class knowledge management practices. When the maturity of knowledge management is graphed against Net FCR, you get the distribution of data shown in Figure 14. As the maturity of the knowledgebase increases, the average Net FLR also increases.
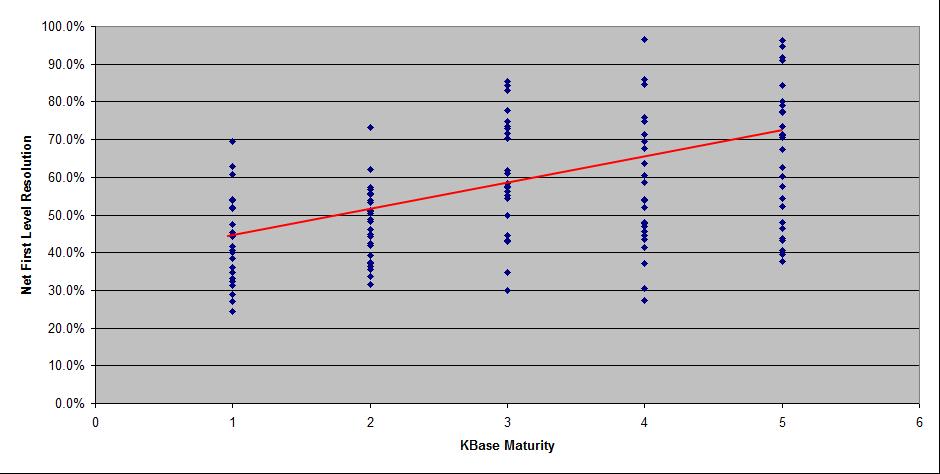 Figure 14
Finally, and somewhat remarkably, simply establishing a goal for Net FLR has the effect of increasing this metric. By holding individual agents, and the service desk overall, accountable for achieving a performance target for net FLR, this number will improve over time!.
Conclusion
Net First Level Resolution is a critically important metric for any service desk to track and trend. It is a proxy for end-user Total Cost of Ownership. Effective management of this metric can reduce TCO by hundreds of thousands, or even millions of dollars per year.
The path to maximizing Net FLR is fairly straightforward. Increased agent training hours, the adoption of remote diagnostic and knowledge management tools, and establishing a target for Net FLR, all have the effect of increasing this metric. A World-Class Performance target for Net First Level Resolution is 95% or better.
Due to space limitations, this article barely begins to scratch the surface on the topic of Best Practices in Service Desk Performance Measurement and Management. In subsequent articles, MetricNet will continue its series on
Successful Benchmarking for the Service Desk, with articles on:
- The Bottom Line on Service Desk Performance: Implementing a Balanced Scorecard for Level 1 Support
- Benchmarking Peer Group Selection: How to Ensure a Fair, Apples-to-Apples Comparison in Your Service Desk Benchmark
- The Benchmarking Performance Gap: Diagnosing the Causal Factors Behind Your Service Desk’s Performance Gaps
- The Cost vs. Quality Tradeoff: How Benchmarking Can Help You Achieve the Right Balance Between Cost and Quality in Your Service Desk
- The Benchmarking Payoff: How to Build a Hard-Hitting Action Plan From Your Service Desk Benchmark
Stay tuned for next month’s article!