Net vs. Gross FLR
To have a meaningful discussion of FLR, we have to make a further distinction between Gross First Level Resolution, and Net First Level Resolution. Gross FLR is the ratio of All Tickets
Resolved at Level 1, to all Tickets
Logged at Level 1. Net FLR, by contrast, is the ratio of All Tickets Resolved at Level 1 to All Tickets that can
potentially be resolved at Level 1.
Gross FLR is self-explanatory. It is a simple ratio that is very intuitive to most people. However, to fully appreciate Net FLR, it is necessary to define a “carve-out”: A carve-out is a ticket type that for one reason or another cannot be resolved at Level 1. A carve-out can be the result of a physical limitation (it is physically impossible to replace a hardware component remotely, at Level 1, for example), or it might be the result of policy or security restrictions placed on Level 1 support, such as when Level 1 is not granted access rights to certain systems. The denominator of the Net FLR ratio is equal to the number of tickets logged at Level 1,
minus the number of carve-outs.
Net FLR is by far the more important of the two metrics, for it measures the true effectiveness of the Level 1 Service Desk to resolve tickets within their purview of defined responsibility.
First Level Resolution and TCO
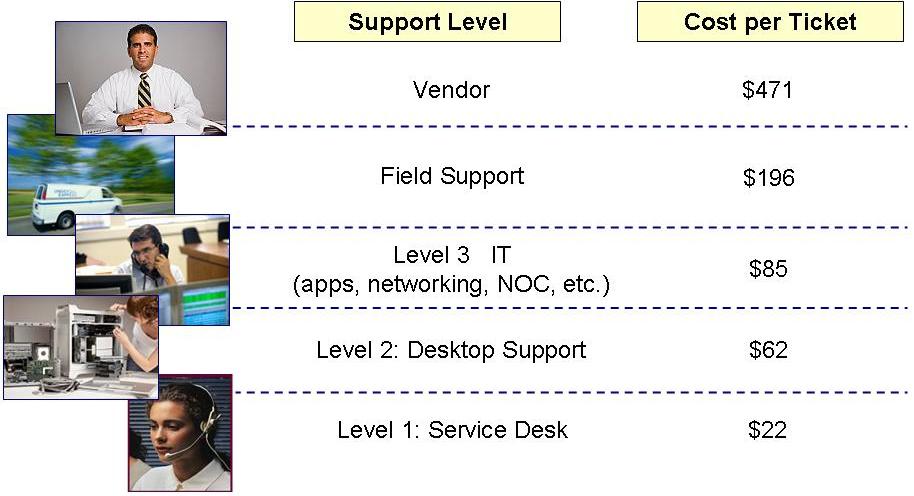
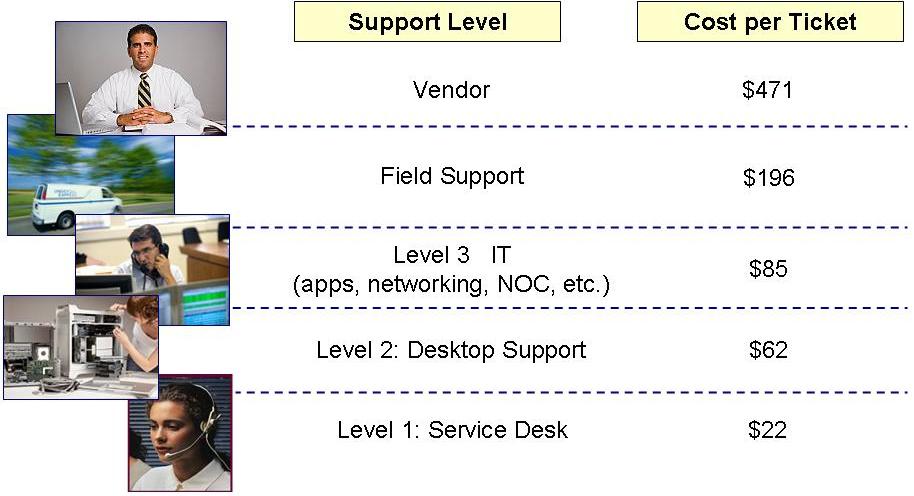
Figure 1 below illustrates the Cost per Ticket for resolution at different support levels. This data represents North American averages, and is a fully loaded cost, including agent salaries and benefits, salaries and benefits for indirect personnel (e.g., trainers and workforce schedulers), facilities expense (rent, lease, or depreciation for the occupied facilities), insurance, telecom, desktop technology (licensing fees, desktop/laptop computers, etc.), travel, training, and office supplies. Clearly, as a ticket is escalated, and resolution moves further away from the Level 1 service desk, the cost of resolution increases. Furthermore, these costs are cumulative. If a ticket is logged at Level 1, and then escalated to Level 2 (Desktop Support) for resolution, the average cost of resolution is not just $62, but $62
plus $22, for a total of $84.
The cost of resolution increases at each successive level for a number of reasons, including longer handle times, and higher salaries at support levels above the service desk. So, for example, a ticket that might be resolved in 10 minutes at Level 1, could take 30 minutes or more to resolve at Level 2 because it requires a visit to the site of the user. The same ticket, when resolved at Level 3, involves personnel that are more highly paid than Level 1 agents, and who are (frankly) slower to resolve tickets because they are not full-time support professionals. The clear implication is that any ticket that
can be resolved at Level 1
should be resolved at Level 1, and that
maximizing FLR is the equivalent of minimizing TCO!
Figure 1: Cost per Ticket by Support Level
Benchmark Ranges for Net FLR
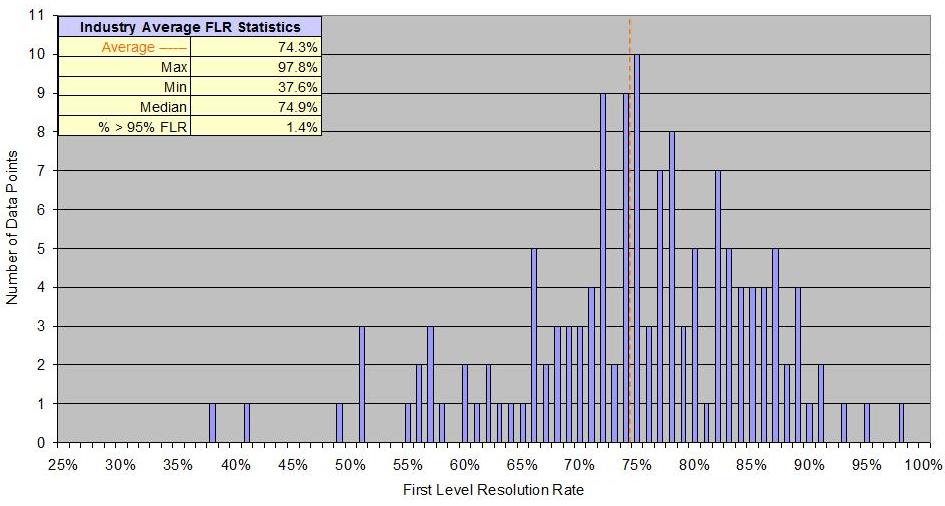
MetricNet’s benchmarking database shows that the average Net FLR for service desks worldwide is about 74%. This number varies widely, however, from a low of about 38%, to a high of 98%. Those at the low end of this range are predominantly “log-and-dispatch” service desks that resolve simple issues such as password resets, but dispatch anything more complex to a higher level of support. Those performing at the upper end of this range generally have highly trained agents that are equipped with tools such as knowledge management systems and remote diagnostic capabilities that enable agents to resolve more than 90% of eligible contacts at Level 1.
Figure 2 below shows the distribution of FLR statistics for a representative cross-section of service desks worldwide.
Figure 2: Benchmarking Statistics for Net First Level Resolution Rate
Please join us for next month’s
Metric of the Month:
Technician Utilization, an important productivity metric that drives Cost per Contact for the Service Desk.