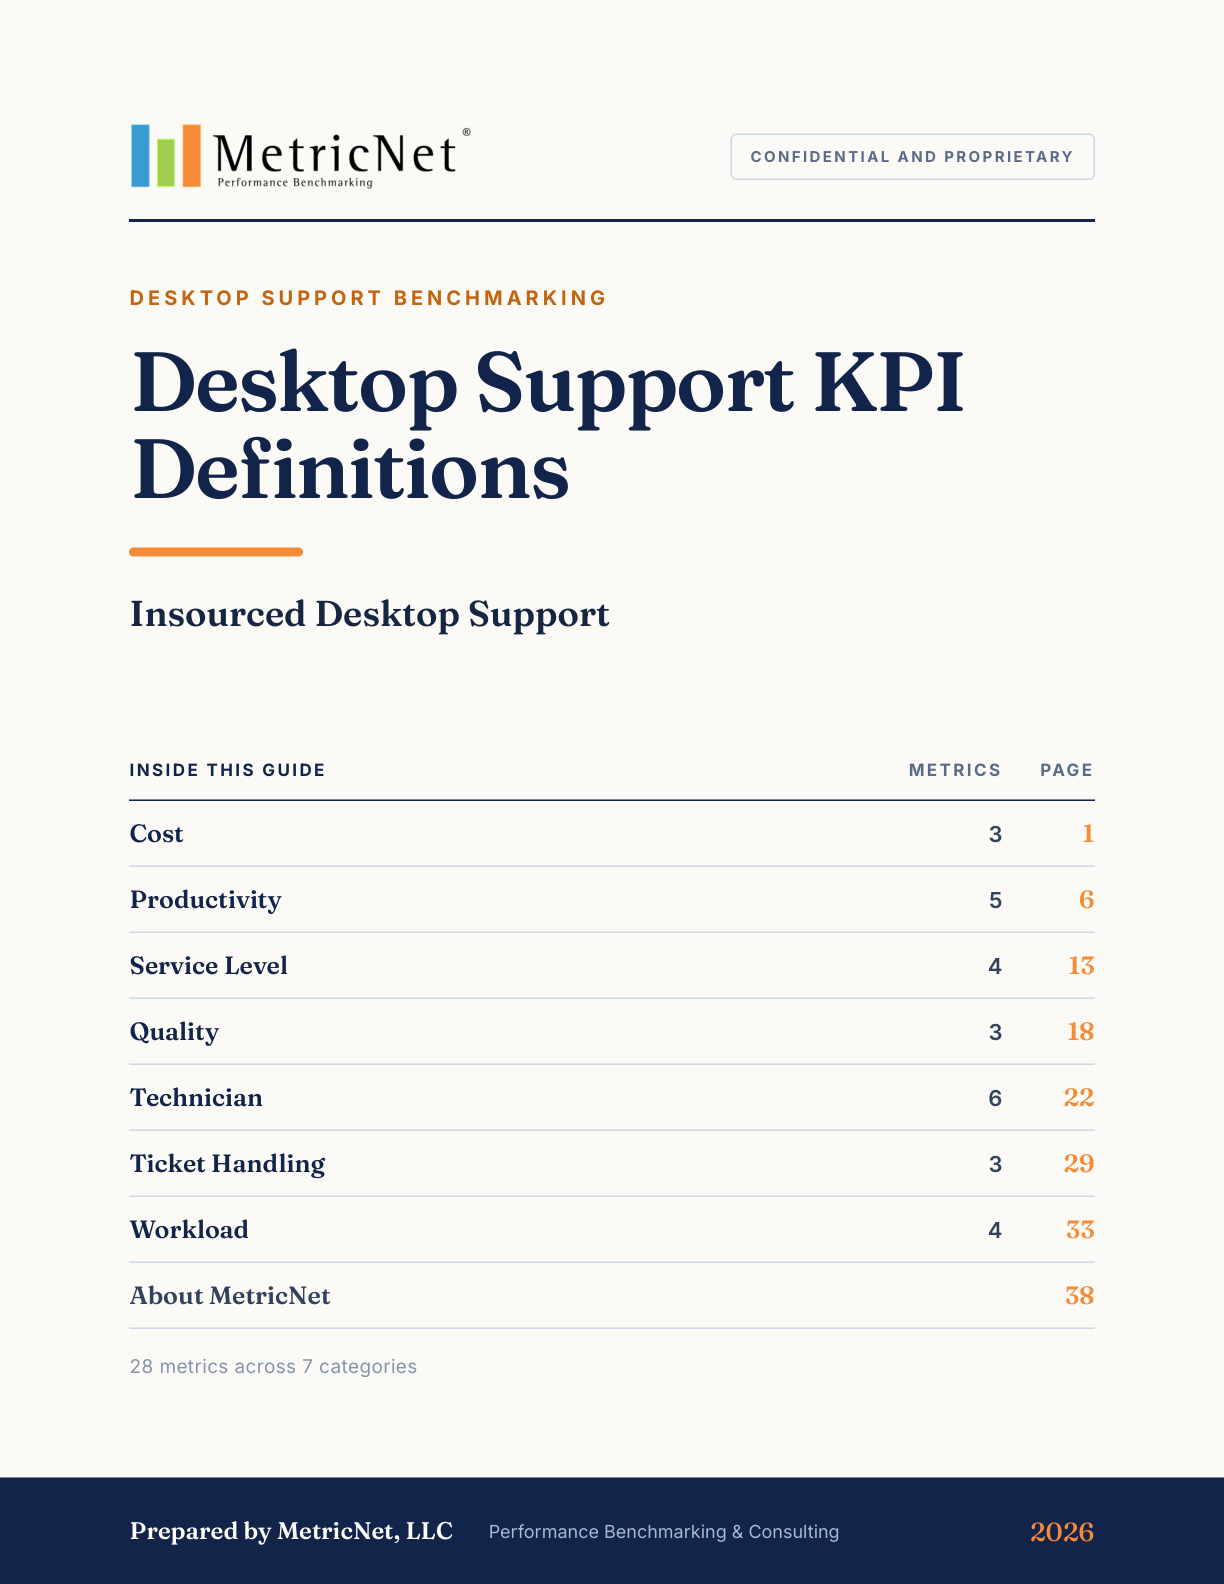

This free 39-page eBook is an introduction to Insourced Desktop Support KPIs including definitions, formulas, information on the importance of each metric & key correlations for 28 Insourced Desktop Support metrics. A brief overview of each metric is listed below.
Cost Metrics
Cost per Ticket is the total annual operating expense of Desktop Support divided by the annual number of tickets handled by Desktop Support. Operating expense includes all employee salaries, overtime pay, benefits, and incentive compensation, plus all contractor, facilities, telecom, desktop computing, software licensing, training, travel, office supplies, and miscellaneous expenses.
Cost per Incident is the total annual operating expense of Desktop Support, multiplied by the incident workload as a percentage of total workload, then divided by the annual incident volume. Incident workload equals the annual incident volume multiplied by Average Incident Work Time (in other words, the total time spent handling incidents in a year). Likewise, total workload equals the annual ticket volume multiplied by the average ticket handle time. Operating expense includes all employee salaries, overtime pay, benefits, and incentive compensation, plus all contractor, facilities, telecom, desktop computing, software licensing, training, travel, office supplies, and miscellaneous expenses.
Cost per Service Request is the total annual operating expense of Desktop Support, multiplied by the service-request workload as a percentage of total workload, then divided by the annual service-request volume. Service-request workload equals the annual service-request volume multiplied by Average Service Request Work Time (in other words, the total time spent handling service requests in a year). Likewise, total workload equals the annual ticket volume multiplied by the average ticket handle time. Operating expense includes all employee salaries, overtime pay, benefits, and incentive compensation, plus all contractor, facilities, telecom, desktop computing, software licensing, training, travel, office supplies, and miscellaneous expenses.
Productivity Metrics
Technician Utilization is the average time that a technician spends handling both incidents and service requests per month, divided by the number of business hours in a given month. (See the more thorough definition on the following page.)
Tickets per Technician per Month is the average monthly ticket volume divided by the average Full Time Equivalent (FTE) technician headcount. Ticket volume includes both incidents and service requests. Technician headcount is the average FTE number of employees and contractors handling Desktop Support tickets.
Incidents per Technician per Month is the average monthly incident volume divided by the average Full Time Equivalent (FTE) technician headcount. Technician headcount is the average FTE number of employees and contractors handling Desktop Support tickets.
Service Requests per Technician per Month is the average monthly service request volume divided by the average Full Time Equivalent (FTE) technician headcount. Technician headcount is the average FTE number of employees and contractors handling Desktop Support tickets.
Technicians as a % of Total Headcount is the average Full Time Equivalent (FTE) technician headcount divided by the average total Desktop Support headcount. It is expressed as a percentage, and represents the percentage of total Desktop Support personnel who are engaged in direct customer-support activities. Headcount includes both employees and contractors.
Service Level Metrics
Mean Time to Resolve Incidents is the average number of business hours that elapse from the time an incident is reported until the time the incident is closed. Non-business hours are excluded from the calculation. For example, if an incident is reported at 3:00 p.m. on Tuesday, and the ticket is closed at 3:00 p.m. on Wednesday, the mean time to resolve (MTTR) will be 8 hours, not 24 hours.
% of Incidents Resolved in 8 Business Hours is fairly self-explanatory. For example, an incident that is reported at 1:00 p.m. on Friday will be resolved in 8 business hours if the ticket is closed by 1:00 p.m. on the following Monday.
Mean Time to Fulfill Service Requests is the average number of business days that elapse from the time a service request is logged until the time the service request is completed. Non-business days are excluded from the calculation. For example, if a service request is logged at 3:00 p.m. on Friday, and the ticket is closed at 3:00 pm on the following Tuesday, the mean time to fulfill (MTTF) will be 2 days, not 4 days.
% of Service Requests Fulfilled in 24 Business Hours is fairly self-explanatory. For example, a service request that is logged at 1:00 p.m. on Friday will be fulfilled in 24 business hours if the ticket is closed by 1:00 p.m. on the following Wednesday.
Quality Metrics
Customer Satisfaction is the percentage of customers who are either satisfied or very satisfied with their Desktop Support experience. This metric can be captured in a numbers of ways, including follow -up calls, email surveys that are automatically sent out by the trouble ticket system, postal surveys, etc.
Incident First Visit Resolution Rate is the percentage of incidents that are resolved on the first visit to the customer. Incidents that require a second visit, or are otherwise unresolved on the first visit for any reason, do not qualify for Incident First Visit Resolution.
% Resolved Level 1 Capable is the percentage of tickets resolved by Desktop Support that could have been resolved by the Level 1 Service Desk. This metric is generally tracked by sampling tickets after the fact to determine the percentage that could have been resolved at Level 1, or by having the Desktop Support technician check a box when closing a ticket, to indicate that the ticket could have been resolved at Level 1.
Technician Metrics
Annual Technician Turnover is the average percentage of technicians that leave Desktop Support, for any reason (voluntarily or involuntarily), in a year.
Daily Technician Absenteeism is the average percentage of technicians with an unexcused absence on any given day. It is calculated by dividing the average number of unexcused absent technicians per day by the average total number of technicians per day that are scheduled to be at work.
New Technician Training Hours is somewhat self-explanatory. New Technician Training Hours is the number of training hours (including classroom, computer-based training, self-study, shadowing, being coached, and on-the-job training) that a new technician receives before he or she is allowed to handle Desktop Support tickets independently.
Annual Technician Training Hours is the average number of training hours (including classroom, computer-based training, self-study, shadowing, etc.) that a technician receives on an annual basis. This number includes any training hours that a technician receives that are not part of the technician’s initial (new-technician) training. But it does not include routine team meetings, shift handoffs, or other activities that do not involve formal training.
Technician Tenure is the average number of months that each technician has worked in a particular Desktop Support organization.
Technician Job Satisfaction is the percentage of technicians in a Desktop Support organization who are either satisfied or very satisfied with their jobs.
Ticket Handling Metrics
Average Incident Work Time is the average time (in minutes) that a technician spends to resolve an incident. This does not include travel time to and from the customer, or time between visits if multiple visits are required to the user’s desktop to resolve an incident. It includes only the time that a technician spends actually working on an incident.
Average Service Request Work Time is the average time (in minutes) that a technician spends to fulfill a service request. This does not include travel time to and from the customer, or time between visits if multiple visits are required to fulfill a service request. It includes only the time that a technician spends actually fulfilling a service request.
Average Travel Time per Ticket is the average round-trip travel time to get to and from the site of a user or device being serviced. In a high -density user environment (e.g., a high-rise office building) the Average Travel Time per Ticket will typically be less than 20 minutes. By contrast, in a more distributed user environment (e.g., field or campus locations), the Average Travel Time per Ticket will be correspondingly longer.
Workload Metrics
Tickets per Seat per Month measures the volume of Desktop Support work generated by a given user population. The number of Tickets per Seat per Month can vary dramatically from one organization to another, driven by factors such as the age of devices being supported, the number of laptop computers, the number of other mobile devices, the location of users (office, home, field), and myriad other factors.
Incidents per Seat per Month is a key measure of the volume of Desktop Support work generated by a given user population. The number of Incidents per Seat per Month can vary dramatically from one organization to another, driven by factors such as the age of devices being supported, the number of laptop computers, the number of other mobile devices, the location of users (office, home, field), and myriad other factors.
Service Requests per Seat per Month is a key measure of the volume of Desktop Support work generated by a given user population. The number of Service Requests per Seat per Month can vary dramatically from one organization to another, driven by factors such as the number of move/add/change requests, the age of devices being supported, the frequency of device refreshes, the location of users (office, home, field), and myriad other factors.
Incidents as a % of Total Ticket Volume is a fairly self-explanatory metric. It indicates the mix of work (incidents vs. service requests) handled by a Desktop Support organization. Most Desktop Support organizations receive more incidents than service requests. Since incidents are generally less costly to resolve than service requests, the higher that Incidents as a % of Total Ticket Volume is, the lower the Cost per Ticket will be.