Percent Resolved Level 1 Capable
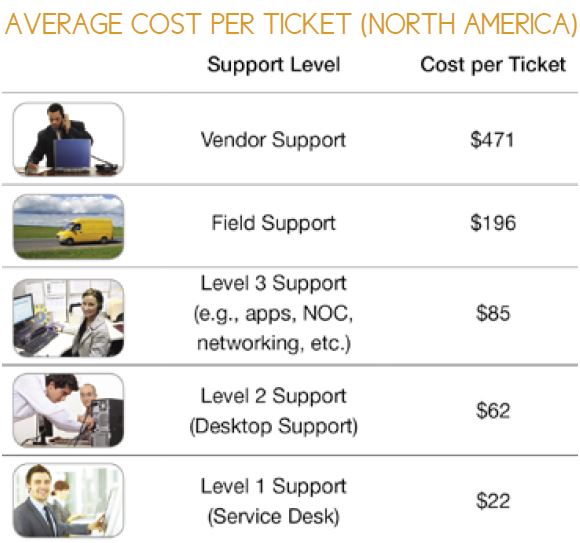
Percent resolved level 1 capable (PRL1C) is a desktop support metric that measures the percentage of tickets resolved by desktop support that could have been resolved by the level 1 service desk. This happens when the service desk dispatches or escalates a ticket to desktop support that could have been resolved by the service desk, or when users bypass the service desk altogether and go directly to desktop support for a resolution to their problems. Ideally, this metric should be as low as possible because it costs much more to resolve a ticket at the user’s location (desktop support) than it does for the level 1 service desk to resolve a ticket remotely.
To maximize PRL1C, you must start tracking the metric at the desktop support level. You can’t control or reduce the number of unnecessarily escalated tickets until you start tracking PRL1C. You should also perform root cause analysis on tickets that were escalated to level 2 but could have been resolved at level 1. Finally, insist upon a strict SPOC model whereby all support requests go through the service desk. By increasing awareness of the importance of this metric at level 1, you’ll reduce the number of tickets dispatched to level 2.
Agent Satisfaction
Customer satisfaction is top-of-mind for virtually every service organization, and for good reason: it’s the single-most-important measure of quality for a service desk or desktop support group. But what about agent satisfaction? Agent satisfaction—the percentage of agents on the service desk that are either satisfied or very satisfied with their jobs—is a bellwether metric that impacts many other service desk metrics. It is positively correlated with customer satisfaction and negatively correlated with agent absenteeism and turnover, meaning that absenteeism and turnover go down as agent satisfaction goes up. If we can control agent satisfaction (which we can, through training, coaching, and career-pathing), then we can drive positive improvements in customer satisfaction, turnover, and absenteeism.
Cost per Ticket
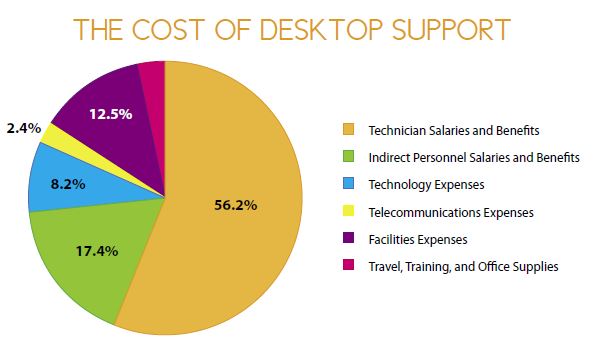
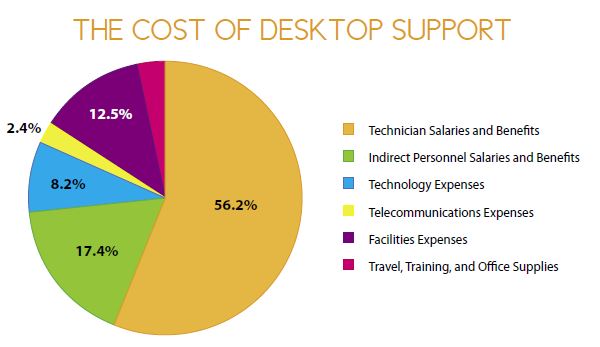
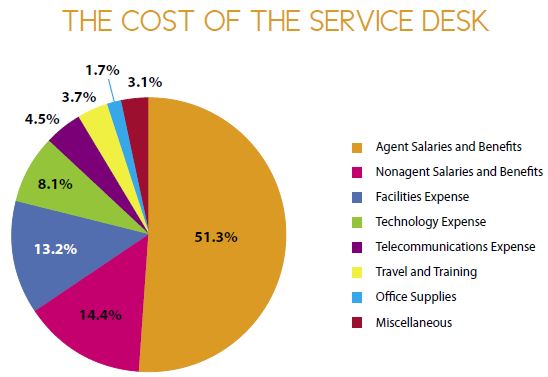
Cost per ticket is the total monthly operating expense of desktop support divided by the monthly ticket volume. As you might expect, the vast majority of costs for desktop support are personnel-related (salaries and benefits), but they also include technology, telecommunications, facilities, travel, training, and office supplies (see the pie chart above). Cost per ticket and customer satisfaction are often referred to as the foundation metrics of desktop support. They are the two most important metrics because, ultimately, everything boils down to cost containment (as measured by cost per ticket) and quality of service (as measured by customer satisfaction).
Customer Satisfaction
Customer satisfaction is the percentage of customers that are either satisfied or very satisfied with the quality of support they receive. There are almost as many different ways to measure customer satisfaction as there are service desks that track the metric. I have seen surveys that contain as few as one question and as many as forty. I have seen multiple choice, fill-in-the-blank, and interview-style surveys. I have seen scoring systems that offer as few as two choices per question and as many as twelve. The result is that customer satisfaction has the greatest variability of any metric in the service desk.
Desktop Support Tickets per User per Month
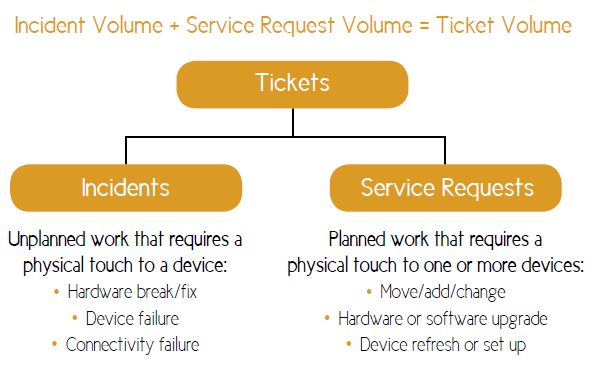
As the name suggests, this metric is simply the total number of monthly tickets logged by desktop support divided by the number of users supported by desktop support. Tickets are the primary unit of work in desktop support, encompassing both incidents and service requests. Ticket volume drives the headcount of technicians needed by an organization, which varies widely from company to company, industry to industry. Ticket volume, in turn, is driven by a number of factors, including the average age of the devices supported, the mix of laptop and desktop computers, the number of remote users, the number of mobile devices, the refresh rate of devices, the standardization (or lack thereof) of the IT environment, and the degree of virtualization. Remember: No two user populations have the same needs, and therefore no two user populations will generate the same volume of tickets (i.e., workload).
Contact Handle Time
Contact handle time is the average time an agent spends on an inbound contact, including talk time, chat time, wrap-up time, and after-call or after-chat work time. For nonlive contacts, such as email, voicemail, and faxes, contact handle time is the average time an agent spends working on the contact before escalating or closing out the ticket. Because contacts are the basic unit of work in a service desk, contact handle time represents the amount of labor required to complete one unit of work.
Contact handle time has a direct impact on and is directly impacted by several other service desk metrics, including the number of contents an agent handles in a month (a productivity metric), first contact and first level resolution, and cost per contact. It’s also an indirect measure of contact complexity, which means that service desks with longer handle times generally require agents to have more training and experience.
Agent Utilization
The best measure of labor productivity is agent utilization. Because agent salaries and benefits represent more than half of all service desk costs (see Figure 3), when agent utilization is high, the cost per contact will be correspondingly low. Conversely, when agent utilization is low, agent costs, and hence cost per contact, will be high. Since the goal of every
business is to achieve the highest possible quality at the lowest possible cost, it stands to reason that organizations would maintain tight control over agent satisfaction.
The formula for calculating agent utilization factors in a number of variables (e.g., the hours in a work day, break times, vacation and sick days, training time) and can be somewhat complicated. But it basically boils down to:
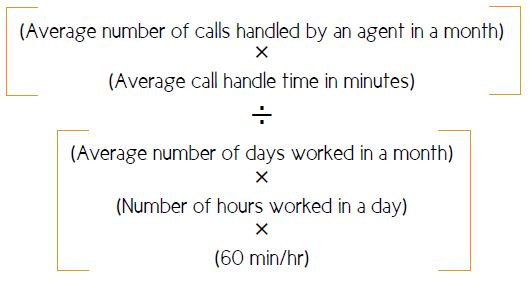
A word of caution: Whenever agent utilization rates approach 60–70 percent, a service desk will experience relatively high agent turnover because they are pushing the agents too hard, leading to burnout and low morale.
Agent-to-Supervisor Ratio
The agent-to-supervisor ratio is simply the number of frontline agents divided by the number of supervisors for a service desk. It is a measure of management span of control and managerial efficiency, and, like most KPIs, there are tradeoffs involved. If the ratio is too high, management span of control is too broad and agents can be working without the proper level of oversight and supervision. This, in turn, can lead to a multitude of issues, ranging from low morale to inadequate training, coaching, and feedback. By contrast, a ratio that is too low indicates that a service desk is top-heavy: it has too many supervisors for the number of agents. This, in turn, leads to higher costs—specifically, higher cost per contact.
There are three techniques for determining the ideal ratio of agents to supervisors. The first is a bottom-up modeling approach that catalogs all of the duties and responsibilities of a supervisor and then assigns a time value to each responsibility. The second approach relies upon industry benchmarks, while the third approach looks at confirming metrics, such as agent job satisfaction.
Call Abandonment Rate
Call abandonment rate is the number of abandoned calls (i.e., the caller hangs up before being connected to a live agent in the service desk) divided by all calls offered to the service desk, and it’s one of the most widely tracked metrics in the service and support desk industry. Most service level agreements include an abandonment rate target, often set quite low. Although a low abandonment rate is a worthy objective, many service desks go too far in trying to reduce abandoned calls, thinking that will increase customer satisfaction. In reality, abandonment has less of an impact on customer satisfaction than first contact resolution.
But while low abandonment rates have virtually no impact on customer satisfaction, they do have a direct impact on cost per contact. In fact, the lower the abandonment rate, the higher the cost per contact. Why? Because to achieve low abandonment rates, you need more agents, which increases the overall cost of support. Benchmarking data suggest that there is an optimal range for call abandonment rate: four to seven percent. If you go much above this range, customer satisfaction will drop off fairly quickly; if you go much below it, costs will climb rapidly.
Mean Time to Resolve
Mean time to resolve (MTTR) is a service-level metric for desktop support that measures the average elapsed time from when an incident is reported until the incident is resolved (note that there is a distinction here between incidents and service requests), and it’s is one of the key drivers of customer satisfaction for desktop support. MTTR varies widely, largely due to population density and travel time. These factors cannot be controlled, but other factors affecting MTTR can certainly be managed, by maximizing the first visit resolution rate (comparable to first contact resolution rate at level 1) and dispatching technicians based on the proximity and geographic clustering of incidents rather than on a first-infirst- out (FIFO) basis. Managing these factors has been shown to reduce MTTR, which increases customer satisfaction.