Your IT Support Value Proposition
What’s your value proposition? If you’re like most service and support organizations, you don’t know because you haven’t gone through the effort to define, quantify, and articulate one. A value proposition is comprised of three elements: 1) a statement of the value that you create for the organization, 2) a quantification of that value, and 3) a statement of your competitive advantage. The value proposition below is framed, and hangs on the wall of a service desk at one of the largest banks in North America:
“The XYZ Support Center is committed to quickly and efficiently resolving customer problems and service requests. We pledge to achieve measurable cost savings of at least two times our annual budget. We will do this while maintaining a 92% or higher customer satisfaction rating.”
Note several things about this value proposition. First, it is succinct: just 44 words. Secondly, it is quantified: 2X cost savings and 92% customer satisfaction is unequivocal. Thirdly, they promise to measure their cost savings. Lastly, the statement is bold, some would say audacious. It gets noticed!
The most important component of your value proposition is the quantified benefit of your service. Without it, your value proposition will likely be dismissed as nothing more than marketing hype and platitudes. Herein lays a key distinction between a value proposition, which explicitly quantifies economic value, and a mission statement, which does not.
So how do you quantify your value to the organization? IT service and support crates economic value in at least four ways:
- Reducing ticket volumes through technology and root cause analysis (RCA).
- Improving end-user productivity by reducing incident resolution times.
- Minimizing Total Cost of Ownership (TCO) by maximizing level 1 resolution rates; and
- Mitigating the effects of downtime through planning, prevention and aggressive remediation.
Perhaps the best way to demonstrate how a value proposition is quantified is with an actual case study.
A mid-size service desk at an insurance company had an operating expense of $4.8 million per year. The desk supported 8,190 users, and handled 21,300 tickets per month. Through aggressive root cause analysis, over the course of a year this service desk was able to reduce ticket volumes from 2.6 tickets per user per month to just 2.2 tickets per user per month. The table below summarizes the results of their RCA program.
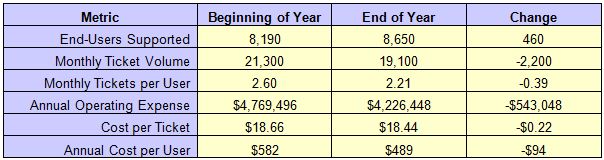
At a savings of $94 per user per year, the total savings attributable to RCA is estimated to be $813,100 ($94 annual savings per user X 8,650 users supported).
Technology can also reduce incoming contacts, and hence the cost of support. Password management tools are a perfect example of this. In North America last year, password resets comprised more than 20% of all contacts to the service desk. By adopting a password management tool, a typical service desk can eliminate half or more of the resets that would otherwise be completed by a live agent. This amounts to real savings for any support organization!
Now let’s take a look now at how service and support can make end-users more productive. The majority of today’s workforce is comprised of knowledge workers, all of whom rely upon one or more computing devices to do their jobs. When these devices break down or do not function properly, employee productivity suffers. By preventing these incidents from occurring, and by quickly resolving issues when they do occur, a support organization can return productive hours to the workforce.
A study conducted by MetricNet and summarized in the figure below concluded that knowledge workers lose an average of 33 hours of productive time per year due to various IT outages, breakdowns, and hardware and software failures. For support groups performing in the top quartile of the industry, the lost productivity per worker is just 17 hours per year; about half the industry average. By contrast, employees who receive support from bottom quartile support groups lose an average of 47 productive hours per year.
The difference between the top and bottom quartile performers is a staggering 30 hours per employee per year! Put another way, support organizations in the top quartile are able to return nearly four extra days of productivity annually for every knowledge worker in the enterprise. When multiplied by thousands or even tens of thousands of employees in a company, the productivity gains and ROI delivered by a top performing support organization can be enormous!
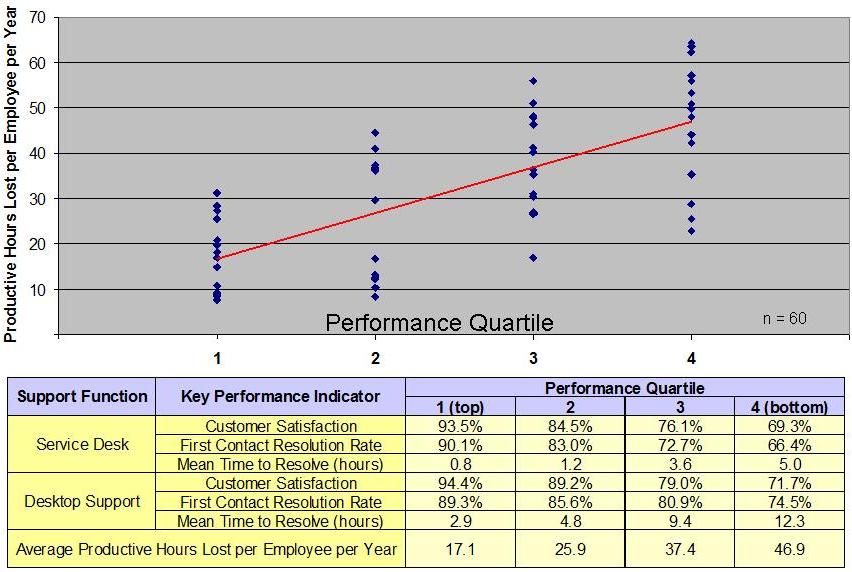
Let’s apply these numbers to the insurance company in our example. We know from benchmarking this company that they are a top quartile service and support organization. We also know from the study referenced above that the difference in lost productivity between a top quartile and an average performer is about 16 hours per user per year (33 hours of lost productivity for an average company – 17 hours of lost productivity for a top quartile performer). When multiplied by 8,650 end-users we can estimate a total labor savings of 138,400 hours per year (16 hours per year saved X 8,650 users). The average work year has about 1,700 productive hours in it, so this labor savings is the equivalent of 81 FTE’s (138,400 hours per year saved ÷ 1,700 work hours per FTE per year). Finally, we know that the average cost per employee in the insurance company is $79,300 including salary and benefits. The economic value of being a top quartile support group is therefore about $6.4 million annually (81 FTE’s X $79,300).
The third source of quantifiable value is the result of reducing support costs by maximizing level 1 resolution rates. Recent benchmarks show that the average level 1 resolution rate for North American service desks is about 82%. What this means is that 18% of all tickets that could and should have been resolved at level 1 are transferred or escalated to another source of support for resolution. These unnecessary escalations represent defects in the support process, and result in increased costs that often go unnoticed because they are rarely tracked. Please note that level 1 resolution is not the same thing as first contact resolution. Level 1 resolution is the number of tickets resolved by the service desk divided by all tickets that can
potentially be resolved by the service desk, regardless of whether the ticket is resolved on first contact or not.
As shown in the figure below, the cost of resolution increases with each successive ticket transfer to a higher level of support. The insurance company in our case study had an impressive 93% first level resolution rate. That is 11 percentage points higher than the industry average, and equates to resolving an additional 25,212 tickets per year at level 1 vs. the industry average (93% FLR - 82% FLR) X (19,100 tickets/month X 12 months). If we now multiply this by the difference in cost between tickets resolved at level 1 vs. tickets resolved at level 2, we can estimate a cost savings of $1,008,480 per year: 25,212 tickets per year X $40 per ticket ($62 per ticket at level 2 - $22 per ticket at level 1).
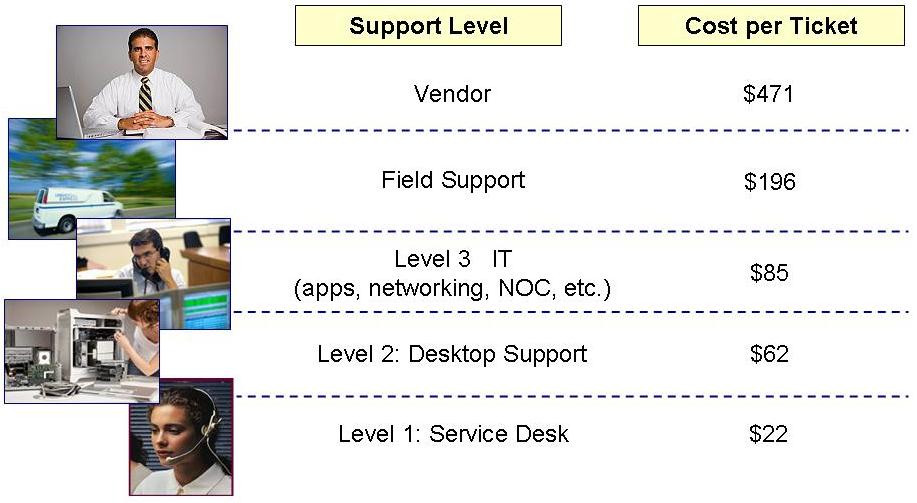
Once again, technology can play a role in reducing an organization’s service and support costs. Knowledge management and remote diagnostic tools are among the most common technologies used to improve first level resolution rates, and hence reduce TCO.
I have deliberately not quantified the fourth source of economic value for IT support – the mitigation of unplanned downtime – because I have yet to find a reliable methodology to estimate this impact. Nevertheless, it is important to acknowledge this source of value, and to actively engage in strategies that reduce unplanned downtime. These include, but are not limited to disaster recovery drills, proactive/outbound user notifications for major downtime events, and recorded messages that inform inbound callers that service and support is aware of and working to resolve any major issues.
To conclude our case study, let’s sum up the economic value delivered by the service desk at the insurance company. We have the following estimated cost savings:
$0.8 million saved through root cause analysis
+ $6.4 million in returned productivity to end users
+ $1 million saved by maximizing first level resolution
========================================================
Total Savings = $8.2 million annually
With an estimated cost savings of $8.2 million, and an annual operating expense of $4.2 million, this support organization is indeed producing economic value far in excess of its costs.
The IT Support Value Proposition Challenge
If you are like most support organizations, and operate without an explicit value proposition, I strongly encourage you to develop one. But having a strong value proposition, by itself, is not enough. You must also effectively communicate your value proposition to key stakeholders, particularly IT management. Moreover, your message must be bold to get noticed, and it must be persuasive enough to overcome any internal resistance to change. While this may take some out of their comfort zones, the alternative – a tactical, subsistence-level support organization – should be motivation enough to overcome any hesitancy you may have about aggressively communicating your value proposition. This is crucial if you wish to transform IT service and support from a tactical cost center, into a strategic source of value creation for the enterprise.
