
The Metrics Hierarchy in IT Service and Support

Leveraging KPIs for Continuous Service Improvement

Today’s service and support technologies make it easy to capture copious amounts of performance data.  Most IT support managers can tell you everything from last month’s ticket volume to yesterday’s average handle time.  But despite all the data that IT service managers have at their fingertips, most cannot answer a very basic question: How is my support organization performing?  Perhaps worse, many IT managers are unaware of the critical role – beyond mere measurement – that Key Performance Indicators (KPIs) can and should play in service and support.  This includes the ability to track and trend performance, identify, diagnose, and correct performance gaps, establish performance goals, and continuously improve performance.

The Power of Leveraging Metrics

Many have heard the sage advice “You can’t manage what you don’t measure.” This is particularly true in IT support, where effective performance measurement is not just a necessity, but a prerequisite for effective decision-making.  Despite the widespread belief in this statement, few support organizations leverage KPIs for their full potential.  In fact MetricNet’s research, gathered from literally thousands of service and support benchmarks, suggests that the vast majority of support organizations use metrics to track and trend their performance – but nothing more!  Unfortunately, in this mode, IT support misses the real value of performance measurement by failing to exploit the diagnostic and prescriptive capabilities of KPIs.

The true potential of service and support KPIs can only be unlocked when they are used holistically, not just to measure and observe performance, but also to:

In short, performance measurement and management is a critical discipline that must be mastered for any support organization that aspires to world-class performance.

The Metrics Hierarchy for IT Service and Support

Empirical data shows that the most effective support organizations follow nine best practices when it comes to performance measurement.  These best practices are summarized in the Metrics Hierarchy illustrated below (Figure 1). 

Figure 1: The Metrics Hierarchy in IT Service and Support
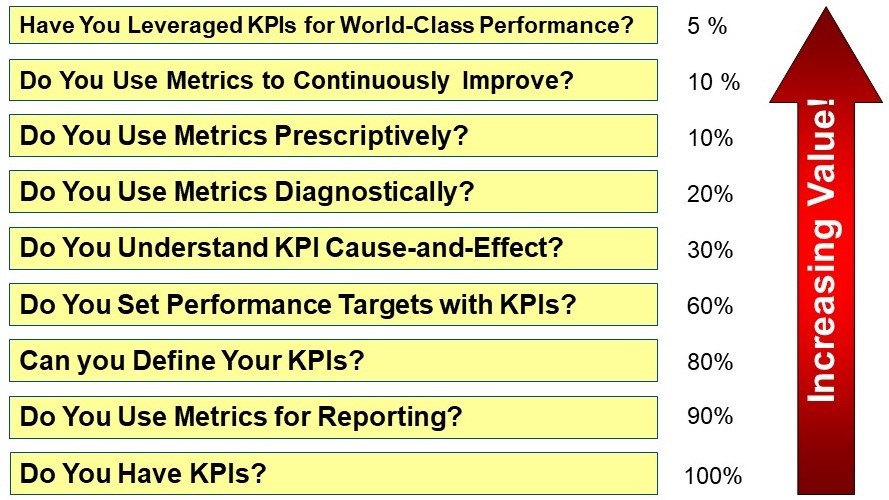
The metrics hierarchy summarizes the sequence of best practices that must be mastered for a support organization to harness the full potential of service and support KPIs.  The numbers to the right of each practice show the approximate percentage of support organizations engaged in each best practice.  The hierarchy is synergistic – each best practice builds on the previous best practice, and adds more value to a support organization.  Yet the data shows that each successive best practice is adopted by fewer and fewer organizations.  This presents a dilemma, as most support organizations fail to mature beyond the point of using metrics primarily for observational purposes.
Do you have KPIs?  Virtually all support organizations have KPIs.  The most commonly used metrics for service desk are summarized below.

Cost Metrics
Cost per Contact
Cost per Minute of Handle Time
First Level Resolution Rate

Productivity Metrics
Contacts per Agent per Month
Agent Utilization
Ratio of Agents to Total Headcount

Service Level Metrics
Average Speed of Answer (ASA)
Call Abandonment Rate
Percent Answered in 30 Seconds

Quality Metrics
Call Quality
Customer Satisfaction
First Contact Resolution Rate

Net Promoter Score (NPS)

Agent Metrics
Agent Job Satisfaction
Agent Turnover
Daily absenteeism
New Agent Training Hours
Annual Training Hours
Agent tenure

Contact Handling Metrics
Contact Handle Time
User Self-Service Completion Rate

And the most commonly used metrics for desktop support are summarized below.

Cost Metrics
Cost per Ticket
Cost per Service Request
Cost per Incident
Cost per Seat Supported per month
Cost per Technician per month

Productivity Metrics
Tickets per Technician per Month
Technician Utilization
Service Requests per Technician per Month
Incidents per Technician per Month

Service Level Metrics
Average Incident Resolution Time (hours)
Average Service Request Resolution Time (days)
% of Tickets Closed within 48 Hours

Quality Metrics
Customer Satisfaction
Incident First Contact Resolution Rate
% Resolved Level 1 Capable

Technician Metrics
Annual Technician Turnover
Staff to Technician Ratio
New Technician Training Hours
Annual Technician Training Hours
Technician Tenure
Technician Job Satisfaction

Workload Metrics
Tickets per Seat per Month
Service Requests per Seat per Month
Incidents per Seat-Month

Do you use metrics for reporting?  Approximately 90% of support organizations use their metrics for some type of reporting.  Reporting is good, but only insomuch as the reports provide insight that leads to better management decisions and continuous improvement.  Most organizations produce too many reports, and don’t gain much, if any, insight from their reports.  But when it comes to reporting, less is more!  A single report that empowers better operational decisions is far more valuable than hundreds of pages of data/reports that produce no action or tangible results.

Can you define your metrics?  80% of support organizations can accurately define their metrics.  For a complete definition of the metrics listed above, including important cause-and-effect relationships, please download MetricNet’s eBooks of KPI definitions for service desk and desktop support.

Do you set performance targets for your KPIs?  Only 60% of support organizations assign performance targets for their KPIs, yet setting performance targets is one of the primary roles of key performance indicators in a service and support organization.  If you don’t have a target for every KPI you track, you should assign one using available benchmarking data.

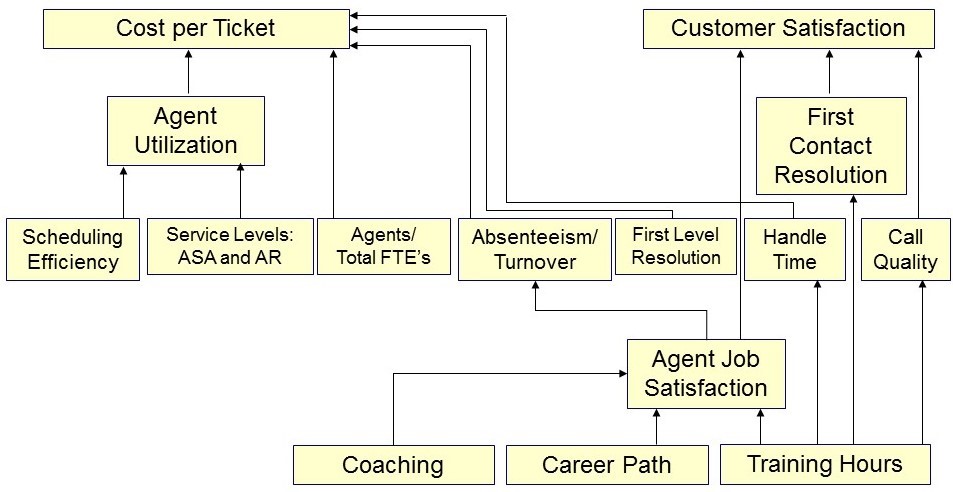
Do you understand KPI cause-and-effect?  Here is where we begin to see a significant drop-off in compliance, as only 30% of support organizations understand the cause-and-effect relationships of KPIs.  You can think of these relationships as a linkage where all the KPIs are interconnected.  When one KPI moves up or down, other KPIs invariably move with it.  Understanding this linkage is enormously powerful because it provides insight into the levers you can pull to achieve desired outcomes.  Moreover, these relationships are key to leveraging KPIs for diagnostic and prescriptive purposes.

The diagram in Figure 2 below illustrates the service desk KPI cause-and-effect relationships.  A very similar linkage exists for desktop support KPIs.

Figure 2: Service Desk Cause-and-Effect Diagram

Do you use metrics diagnostically?  Diagnosis simply means that you interpret your metrics, and use them to identify the underlying drivers of any performance gaps in service and support.  For example, if your service desk customer satisfaction is low, it is most likely the result of a below average first contact resolution rate.  Likewise, if your cost per ticket is high, it is most likely due to lower than average agent utilization, which in turn can be caused by over-staffing.

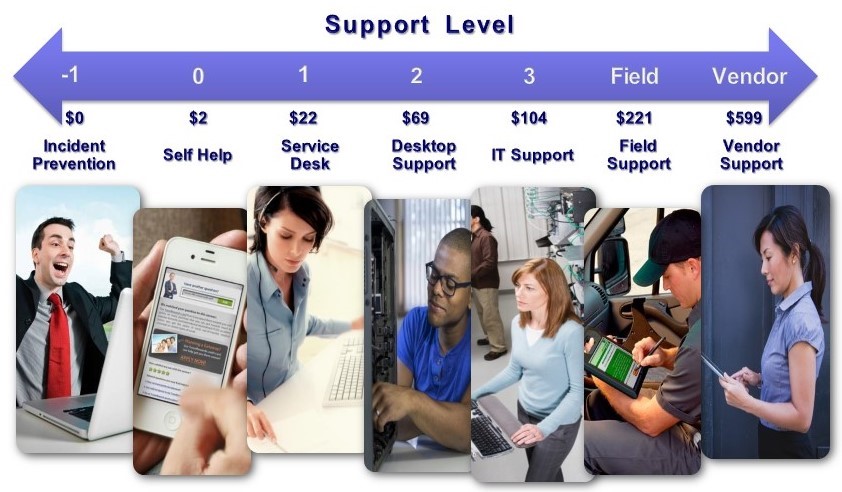
Do you use metrics prescriptively?  A natural follow-on to diagnosis is prescription – i.e., defining the actions you will employ to eliminate or mitigate negative performance gaps, while taking comparable measures to sustain and perpetuate the positive performance.  There are an infinite number of prescriptions that might follow a diagnosis, but you should look first for the proverbial “low hanging fruit” – those actions that are relatively easy and low cost to implement, yet yield a significant improvement in performance.  Two very common prescriptions that appear in many action plans are shift left and increasing volume in the user self-help channel.  The power of shift left is illustrated in the TCO diagram in Figure 3 below:

Figure 3: Shift Left Reduces Total Cost of Ownership


Do you use metrics to continuously improve?  The term “continuous improvement” has become so cliché that it is almost meaningless at this point.  The fact is, most improvement initiatives in IT service and support progress incrementally, if at all.  Yet there is one proven tool that enables support organizations to rapidly improve their performance by building upon the proven best practices of the industry’s superior performers.  That tool is benchmarking.  Industry data shows that there is a virtual one-to-one correspondence between support organizations that conduct annual benchmarks, and support organizations that achieve world-class performance.

Have you leveraged KPIs for world-class performance?  There are four criteria to achieve world-class performance in IT service and support: 1) High customer satisfaction, and specifically top quartile customer satisfaction relative to a peer group of support organizations comparable to your own; 2) Low cost per ticket, specifically bottom quartile cost per ticket relative to a comparable peer group; 3) Industry best practices are integrated into the support organization; and 4) The support organization produces a measurable ROI of greater than 100%.

When it comes to the metrics of IT service and support, the Metrics Hierarchy should guide your path to maturity.  As you progress upward through the hierarchy, mastering each step in the process, you should see a marked improvement in your performance as a direct result of your metrics maturity!