The self service completion rate is an IT service desk metric that measures the percentage of level 1 incidents that are self-resolved by the user, without the assistance of a live agent. Let’s say, for example, that the agents on a particular service desk handle 4,000 incidents per month through voice, chat, and email. Another 1,000 incidents per month are resolved through user self-service (e.g., through a password reset tool). For this hypothetical service desk the self-service completion rate is 1,000 self-service incidents ÷ 5,000 total incidents = 20% self-service completion rate.
The self-service completion rate is typically driven by the adoption of technologies that enable users to resolve their own incidents. The most common of these technologies include password reset tools, online FAQ’s, and self-help portals that give users access to the solutions knowledge base. Some of these tools are quite powerful, and offer the users robust search capabilities for finding a solution to their specific need.
Download This Article Forward To A Friend
Why It’s Important
Last year the average cost of resolving an incident at level 1 in North America was about $22. If some of these incidents can be deflected to self-service, that reduces the headcount requirements and hence the cost of the service desk. Years ago, some in the industry were predicting that user self-service tools would become so powerful that level 1 support would become obsolete. That, of course, did not happen, and it probably never will happen.
There are limitations on what can and should be resolved through self-service. As technology advances, incident complexity also increases. Developing knowledge articles that keep up with technology, and offering them in a friendly, searchable format for user self-service is a very challenging task. Moreover, you probably
don’t want your users spending a lot of time searching for solutions to their IT problems. Take the case of a user who spends two hours self-resolving a how-to issue for a proprietary business application. If that user could have gotten the same solution in 15 minutes by contacting the service desk, clearly that is the better support channel. This is the primary reason that most incidents resolved through self-service tend to be fairly straightforward – password resets, desktop application how-to’s, and the like.
It is worth noting that as the self-service completion rate increases, organizations typically see an increase in the cost per agent-assisted contact. The reason for this is fairly obvious. The incidents resolved through self-service tend to have fairly short handle times when resolved by an agent. As these lower handle time incidents are deflected into the self-service channel, the average complexity, and hence the average handle time of the incidents that continue to be handled by live agents will increase. This, in turn, increases the average cost of an agent-assisted incident.
Benchmark Data for Self-Service Completion Rate
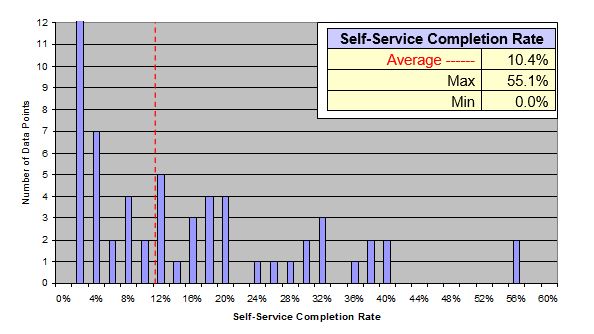
MetricNet’s benchmarking database shows that the average self-service completion rate for service desks worldwide is 10.4%. This number varies widely, however, from a low of 0% for many service desks with no self-service capabilities, to a high of 55%. Not surprisingly, the vast majority of these self-resolved incidents are password resets. In fact, password reset tools are one of the most common technologies found in IT service and support, and have generally been shown to have a very favorable ROI.
Figure 1 below shows the distribution of self-service completion rate for a representative cross-section of service desks worldwide.
Figure 1: Self-Service Completion Rate

Please join us for next month’s
Metric of the Month:
Chat Metrics – An Overview, where we will explore some of the more common metrics for chat support.
Download This Article Forward To A Friend