Service Desk Agent Occupancy | IT Service Desk Metrics

  Agent occupancy is an IT service desk metric that measures the percentage of logged in time that an agent is actually delivering customer service. Let’s say, for example, that an agent is logged into the service desk ACD for six hours a day, and is in talk, hold, or wrap mode for four of those six hours. In this case, agent occupancy would be calculated as 4 hours ÷ 6 hours = 66.7% agent occupancy. Likewise, let’s say that an agent is logged into the ticketing system for seven hours a day, and is responding to customer tickets that are emailed to the service desk for five of those seven hours. The calculation for agent occupancy in this case would be 5 hours ÷ 7 hours = 71.4% agent occupancy. Agent occupancy is oftentimes confused with agent utilization. Although the numerator is the same for both metrics, the denominator is different. The denominator for occupancy, as explained above, is the total time that a voice, email, or chat agent is logged into the system. By contrast, the denominator for agent utilization is the total time that a voice, email, or chat agent is at work, including the time that the agent is logged into the system. To continue with our example from above, let’s assume in both cases that the agent is at work for a total of eight hours.  In the first example, the agent utilization would be 4 hours ÷ 8 hours = 50% agent utilization.  Likewise, in our second example the agent utilization would be 5 hours ÷ 8 hours = 62.5% agent utilization.  Agent utilization will always be less than or equal to agent occupancy.
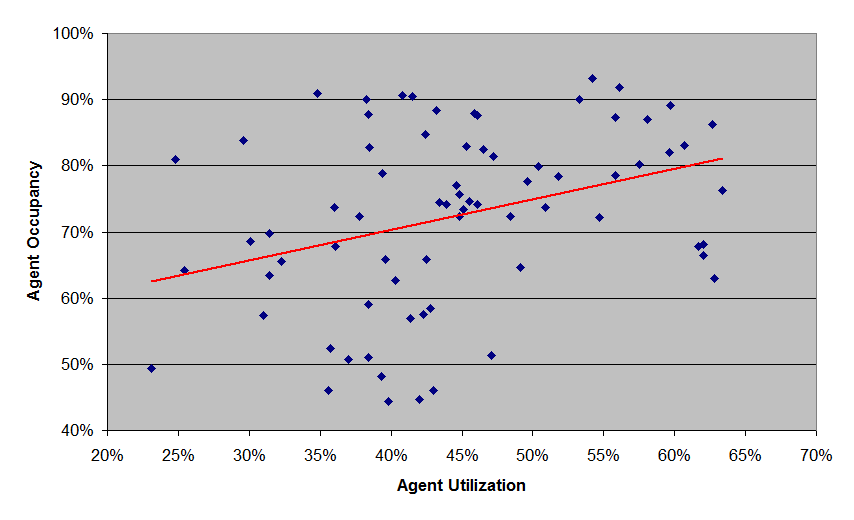
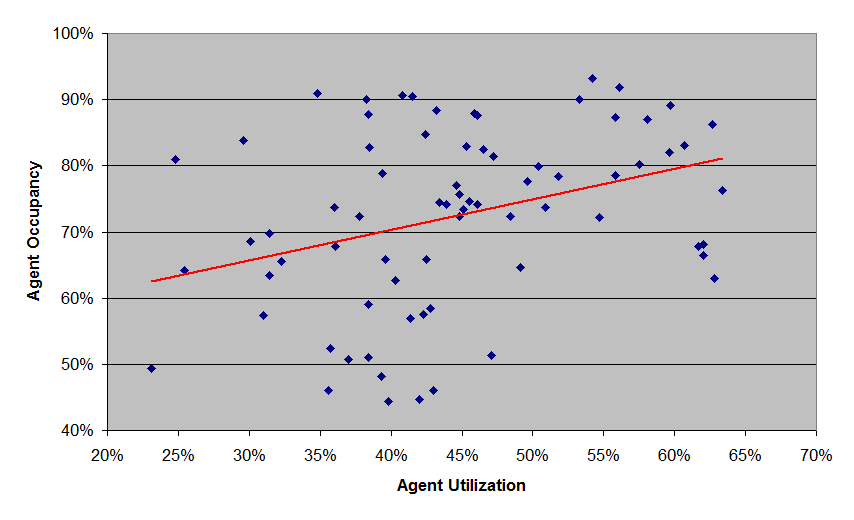
Download This Article Forward To A Friend While agent occupancy and utilization have a weak correlation (Figure 1 below), it is possible to have a high agent occupancy and a low agent utilization.  This scenario occurs when agents are not logged into the system for very many hours each day, but are fairly busy when they are logged into the system.  For this reason, agent utilization is recognized as a more accurate indicator than agent occupancy for overall agent productivity.  Additionally, while low agent occupancy guarantees that agent utilization will also be low, the reverse it not true: high agent occupancy does not guarantee a high agent utilization rate.  Finally, when agent occupancy and utilization diverge – i.e., high occupancy and low utilization – this is generally an indication that the service desk is overstaffed.

Figure 1: Agent Occupancy vs. Agent Utilization

Agent Occupancy vs. Agent Utilization

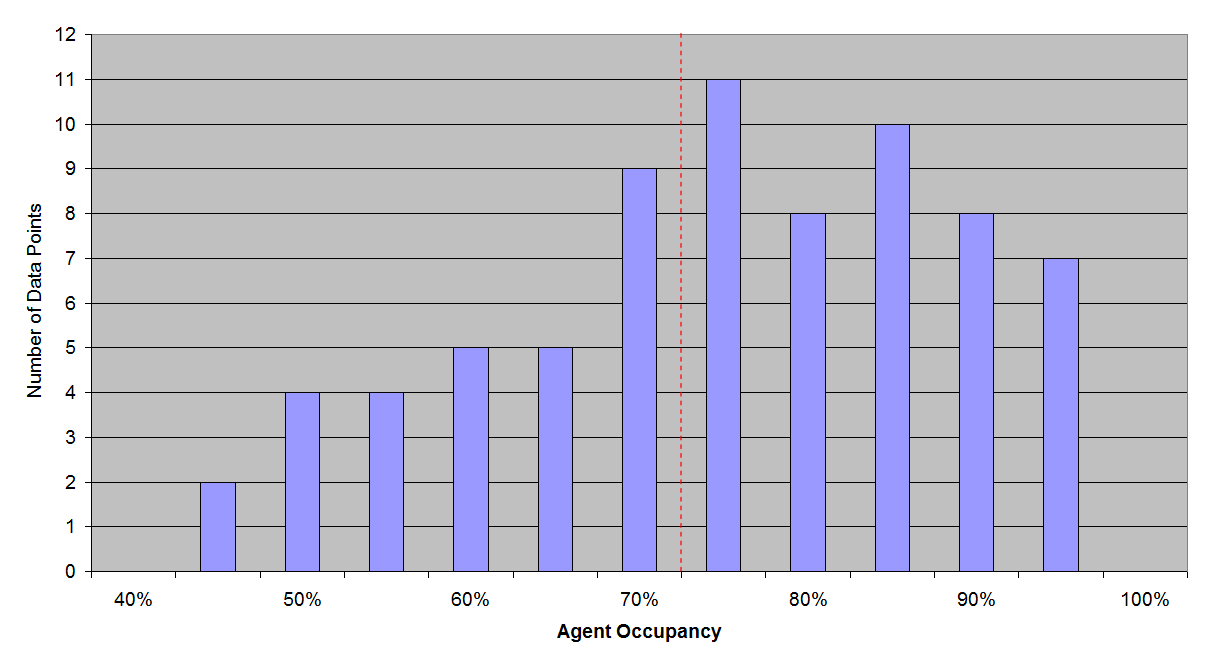
Benchmarking Ranges for Agent Occupancy MetricNet’s benchmarking database shows that the average agent occupancy for service desks worldwide is about 73%.  This number varies widely, however, from a low of 44% to a high of 93%.  Those at the low end of this range tend to be smaller service desks that are unable to achieve economies of scale, or service desks that are overstaffed.  Those at the higher end of this range tend to be service desks that have good scale economies and good agent scheduling practices. Figure 2 below shows the distribution of agent occupancy for a representative cross-section of service desks worldwide.

Figure 2: Benchmarking Statistics for Agent Occupancy

Benchmarking Statistics for Agent Occupancy

In summary, agent occupancy is a common and important service desk metric to track and trend.  And it does provide an indication of how productive an agent is while they are logged into the system.  But for the reasons outlined above, agent occupancy has limitations, and agent utilization is a better overall indicator of agent productivity. Please join us for next month’s Metric of the Month: Technician Utilization for desktop support, which is calculated very differently than technician utilization for the service desk. Download This Article Forward To A Friend