Benchmarking is an inexact science. Because of differences in the way Service Desks define their metrics, account for their costs, and track their performance, there will always be some inconsistency in the way Service Desks report benchmarking data. As an example, one Service Desk may define an abandoned call to be any call that is dropped at any point after a call hits the ACD. By contrast, another Service Desk will define an abandoned call to be any call that is abandoned only after a caller has waited on the line for at least 20 seconds before abandoning. Clearly, these different definitions will yield different results for call abandonment rate,
even if the two Service Desks have exactly the same number of abandoned calls.
These inconsistencies become even more pronounced when looking at costs, and specifically cost per call, one of the foundation metrics that every Service Desk should be tracking. Because of differences in the way Service Desks account for their costs – depreciating vs. expensing an asset, for example – cost metrics can vary dramatically between Service Desks
even when their spending levels are exactly the same.
My point is that any data used for benchmarking is imprecise. That’s right…it lacks precision! No one else in the industry will admit to this fundamental drawback in benchmarking, but it is critical to understand this limitation. Too often, those who engage in benchmarking draw conclusions based upon small performance gaps. This can lead to serious problems because a Service Desk may take action based on a
perceived performance gap that does not really exist. Despite this, benchmarking is still an extremely valuable tool. However, it is a blunt instrument, and the lack of precision has profound implications for how the results or your benchmark are interpreted.
Benchmarking is good for identifying large performance gaps, but is simply ineffective at identifying small differences in performance between your Service Desk and a peer group. The implication is that small performance gaps are usually meaningless. These small performance gaps are “down in the noise”, as they say. As a rule of thumb, whenever I come across a benchmarking performance gap in the 1% - 5% range, I ignore it. Benchmarking data is simply not precise enough to guarantee accuracy to within plus or minus 5%. Performance gaps in the 5% - 10% range, however, may be meaningful. But at this level I look for corroborating evidence from other metrics before I assume that a real performance gap has been uncovered. It is only when the performance gap is 10% or greater that I can conclude with confidence that a real performance gap exists. In the jargon of the industry, this is “directional accuracy”. The results of any benchmark are never precise, but they are directionally accurate, meaning that you can act on them with confidence when the performance gap is large enough to outweigh any inconsistencies in the benchmarking data that is reported.
The second myth I would like to address is the notion that you can only benchmark against other Service Desks that look just like yours. This is pure fallacy. First off, if a Service Desk
looked just like yours, there would be no point benchmarking it because it would
perform just like yours! Secondly, there is no such thing as a Service Desk that looks just like yours”…it doesn’t exist! There are simply too many differences between Service Desks to even hope that you will find a peer group of Service Desks that look just like yours. These differences include the types of transactions handled, the volume of transactions, geographic location, and a host of other factors.
Both of these points are designed to make a larger point, which is that you have a lot of latitude and flexibility when it comes to peer group selection. In fact, this is one of the most creative parts of the benchmarking process. Please rid yourself of the notion that you can only benchmark against other Service Desks from your industry. As you will see below, some of the best benchmarking candidates are likely to come from
outside of your industry.
Dynamic Peer Group Selection
Dynamic Peer Group Selection (DPGS)™ is a clearly defined process of selecting companies for benchmarking that ensures a fair and valid comparison of data from one Service Desk to the next.
The DPGS™ process assumes that the benchmarking data you are compared to is timely and accurate, and that there is a common methodology to collect the data. There should also be a set of measurements, or KPI’s, agreed upon for the benchmarking comparison.
DPGS™ is built upon a number of criteria that should be considered when selecting a peer group for any benchmark. These criteria include:
- Willingness to benchmark
- Transaction types
- Scale (i.e. volume of transactions handled)
- Industry
- Geography
These are among the most important criteria to consider in peer group selection, but this is by no means an exhaustive list. Additionally, even taking these factors into consideration, the benchmarking performance comparisons by themselves may be invalid unless other adjustments are made to the data. As I discuss each of the major criteria that make up the DPGS™ methodology, I will also explain how performance differences due to these factors can be normalized out of any benchmarking comparison.
Let’s take a closer look at each component of DPGS™.
Willingness to Benchmark
Contrary to what some may believe, benchmarking is not a cloak-and-dagger exercise that is performed surreptitiously, without the knowledge of the Service Desks being benchmarked. Although it may be possible using competitive analysis techniques to learn some things about a Service Desk without their participation, true quantitative benchmarking requires the active participation of every Service Desk in the peer group.
Some companies fear that such active participation in benchmarking may publicly reveal information about their performance that they would rather keep private. In this case, it is important to implement measures to ensure the privacy of their data. When participating in any benchmark, you should make sure that your benchmarking consultant or facilitator takes precautions to protect the identity and security of your confidential data, just as MetricNet does in its syndicated benchmarks.
At MetricNet, we believe that willingness to benchmark is the single most important factor in selecting Service Desks for your benchmarking peer group. Service Desks that are actively and enthusiastically engaged in the benchmarking process are far better candidates for benchmarking than those who only grudgingly share their data, or who otherwise don’t invest the time necessary to provide valid data for their benchmark.
Although such a willingness to share data is no panacea, it is a prerequisite to successful benchmarking. That, in addition to committing to metrics; putting the benchmarking infrastructure in place; consistently collecting accurate and complete data; and rigorously analyzing the performance gaps. This first component of DPGS™ may seem obvious, but it is surprising how often this bit if wisdom is ignored. So above all, you should seek out Service Desks for your peer group that are willing to share their data on an open and candid basis.
Transaction Types
It should be immediately obvious that you would never benchmark a password reset Service Desk against an enterprise applications support Service Desk, or a desktop shrink wrap support Service Desk against an SAP Service Desk. The transaction types are simply too different to obtain a valid benchmarking comparison. The handle times will be different, the nature and complexity of the calls will be different, the agent skill sets will be different, and the performance metrics will be different.
So the second criteria in DPGS™, therefore, is to ensure that the Service Desks you benchmark against are handling similar transaction types. The peer group doesn’t necessarily have to have the same transaction
volumes, but the types of transactions handled should be very similar. If your Service Desk handles password resets and MS Office support, then the Service Desks you benchmark against should do the same thing.
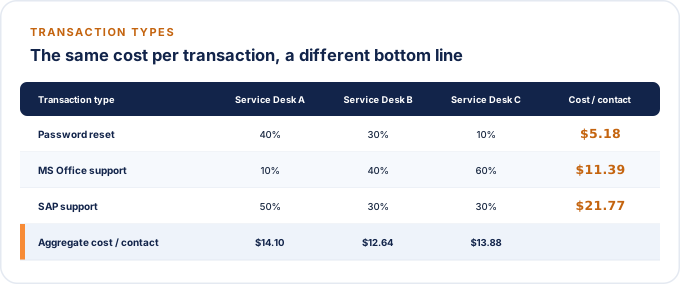
But keep in mind that handling the same types of transactions does not necessarily ensure a fair benchmarking comparison. You must also take into account the relative volumes of each transaction. As Figure 1 below illustrates, different Service Desks can handle the same types of transactions, but if the
percentage of each transaction type is different, the aggregate handle times will also be different even if the handle time for each transaction type is the same. Since call handle time is the single biggest driver of labor, and hence cost, these Service Desks may appear to have differences in their cost per call, when in fact it is the
percentage of each transaction type that is driving the cost differences shown. Fortunately these differences are easily normalized by making adjustments for the unique mix of calls in your call profile.
Scale
Virtually everything in the Service Desk is subject to scale economies. This is particularly true when it comes to the volume of contacts handled. The approximate scale effect for volume is 7%. What this means is that every time the number of transactions doubles, you should expect to see the cost per contact decline by 7%. So, for a Service Desk that handles 10,000 transactions per month at a cost of $20 per contact, you could expect to see the cost per contact drop by 7%, to $18.60 per transaction, if the volume doubled to 20,000 transactions per month. Likewise, if the volume doubled yet again, to 40,000 transactions per month, the cost per contact would decline by another 7%, from $18.60 to $17.30 per transaction. This is one of the major drivers of the trend towards consolidation that we see in the industry. Larger Service Desks are simply more efficient than smaller Service Desks due to this scale effect. This trend is illustrated in Figure 2 below, which shows the effect of scale for more than 100 different Service Desks.
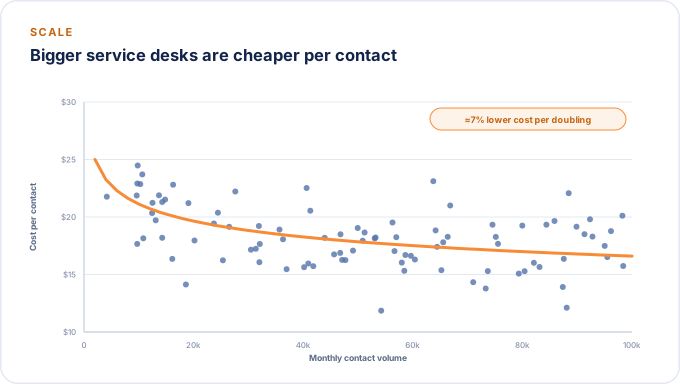
When selecting a peer group for benchmarking comparison, you should strive to identify peers that are similar to yours in the number of transactions handled. Additionally, you should make adjustments for any differences in scale between your Service Desk and the peers by adjusting your cost per contact using the 7% rule mentioned above.When selecting a peer group for benchmarking comparison, you should strive to identify peers that are similar to yours in the number of transactions handled. Additionally, you should make adjustments for any differences in scale between your Service Desk and the peers by adjusting your cost per contact using the 7% rule mentioned above.
Industry
Benchmarking solely within your own industry and against direct competitors may be appropriate during the early stages of benchmarking, when the competitive “gap” between your organization and the best in your industry is the widest. But as your organization’s performance improves, the gap will narrow and it will become necessary to reach for loftier goals. To achieve world-class performance, superior practices from non-competitors must be adopted. This requires that you benchmark against out-ofindustry companies.
Having Service Desks from your particular industry is the least important factor in DPGS™. It is not uncommon to see multiple industries represented in a Service Desk benchmark. In fact, it is encouraged! As you will see below, you often gain more insight by benchmarking against Service Desks from outside of your industry. Nevertheless, Service Desks from a particular industry, whether from utilities, financial services, retail, or any other industry, do share certain common characteristics. So it is worth considering these in-industry Service Desks for your peer group. But once again, industry considerations should take a back seat to other factors such as scale and transaction type when selecting your peer comparison group.
The more important point when it comes to selecting benchmarking peers from a particular industry is the potential to gain “breakthrough insights” by benchmarking against Service Desks from
outside of your industry. Federal Express beat the competition in the early 1990’s by developing the most advanced package tracking system in the express delivery business. They were the first in their industry to use bar coding and computerized package tracking, and other competitors soon followed suit. But they did not adopt this technology from another express company. Rather, the bar code technology was originally “borrowed” from the grocery store industry, and computerized package tracking was “borrowed” from a government logistics operation. Benchmarking companies outside of the express package industry gave Federal Express a decided lead in their industry at the time. It helped them achieve the highest profitability of any player in the industry, and forced the competition to play catch up.
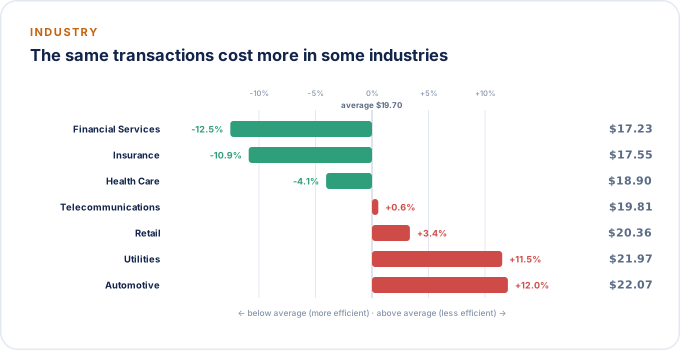
The same is true of Service Desks. MetricNet has seen literally hundreds of examples of Service Desks that have gained a competitive advantage by adopting ideas, processes, and technologies from outside the industry. As you can see in Figure 3 below, Service Desks handling exactly the same types of transactions are simply more efficient in some industries than in others. When selecting your benchmarking peer group you should you should always consider candidates from outside your industry because they often provide the greatest insights for Service Desk improvement.
The cardinal rule when selecting benchmarking candidates is to maximize the amount of learning you take away from the process. Selecting companies in the same industry that tell the same story will often yield fewer insights than benchmarking against diverse organizations, each of whom takes an innovative and unique approach to providing enduser support.
Geography
The main factor that is affected by geography is cost; specifically labor cost. Since labor accounts for 65% of service desk operating expense, it is important to normalize North American Service Desks, for example, never benchmark against Service Desks from India or other low-cost regions of the world because the labor cost differential is simply too great. Even within the United States and Canada, starting salaries can vary by as much as 50% depending upon where the Service Desk is located.
Cost differences due to geographic disparities can be normalized or “factored out” when doing your benchmark. The basic approach is to look at the cost of living index for a particular region, and adjust the labor costs accordingly. These cost of living indexes are published by a variety of services, but the one used most frequently by MetricNet is produced by the American Chamber of Commerce Association. Figure 4 below shows the cost per contact for various bank Service Desks in different regions of North America. You can see that the cost per contact when unadjusted for cost of living differences is quite substantial. However, once the cost of living differences are factored into each Service Desk’s costs, the range of values for cost per contact is not nearly so great. In fact, one Service Desk in New York that initially appeared to be high cost, was actually lower cost than the average of the peer group after adjusting for cost of living differences.
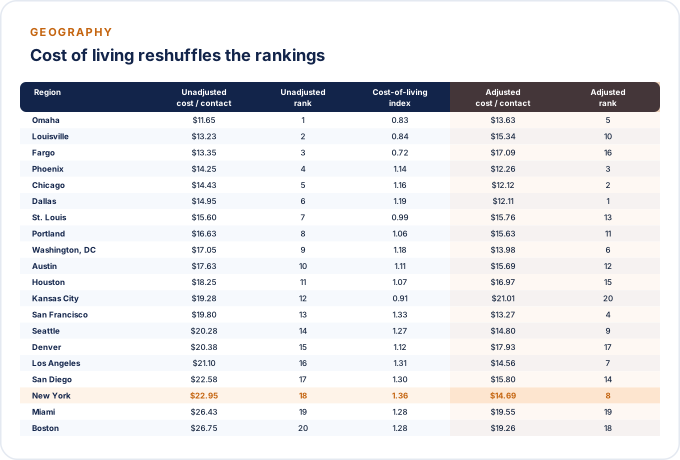
These types of normalizations or “adjustments” for things like scale and geography are critically important when doing benchmarking. Without them, the reported performance gaps are simply not valid. Worse, Service Desks that do not make these adjustments to their benchmarking data run the risk of taking action based on “false” performance gaps.
The Law of Large Numbers
One of the perennial problems in benchmarking is finding a peer group large enough to produce a meaningful benchmark. As a veteran of several consultancies, I am convinced that the vast majority of Service Desk benchmarks do not have nearly enough data points to draw any valid conclusions.
Obviously the more companies you have in your benchmarking peer group, the better. The validity of benchmarking data increases geometrically as the peer group grows in size. With fewer than five companies in a peer group, a benchmark is simply invalid; there is not enough data in such a small peer group to draw any meaningful conclusions. With a peer group of five to ten, the data becomes more meaningful, but is reliable only for diagnosing large performance gaps. With a peer group of 10 or more, the benchmarking data begins to gain some statistical validity. Among other things, with a peer group this size you have an error canceling effect, whereby data errors on the plus side tend to be cancelled out by data errors on the negative side.
Although benchmarking syndicates – large groups of Service Desks that join together for the purpose of benchmarking – are relatively new, MetricNet favors this type of benchmarking consortia because they guarantee a larger peer group than the “one off” benchmarks that are so common in the industry. Participating in a benchmarking consortium, in turn, greatly improves the statistical validity of your benchmarking results. Whenever possible, your Service Desk benchmark should be done as part of a benchmarking syndicate or consortium. This will ensure that your benchmarking peer group is large enough to produce meaningful results.
Conclusion
When it comes to benchmarking peer group selection, there are no hard and fast rules. Nevertheless, there are some guidelines that will dramatically improve the value of your benchmark, and the validity of your benchmarking results. Specifically, you should look first for a willingness to benchmark on the part of other Service Desks. This is the single most important factor in selecting peers for your benchmark. Secondly, make sure that your benchmarking peer group handles similar transaction types as your Service Desk. If the types of transactions handled by the peer group is different than those handled by your Service Desk, the benchmarking comparison will be invalid. Thirdly, recognize that scale has a significant impact on your costs. When benchmarking against Service Desks with different transactions volumes, you can make adjustments for scale based on the 7% rule explained in this article. Fourth, don’t get hung up on the idea of benchmarking only against other Service Desks from your industry. Some of the most valuable benchmarking insights are gained by looking at Service Desks from outside of your industry. And finally, keep in mind that the geographic location of a Service Desk will have an impact on labor costs, and hence the cost per contact. These labor cost differences can be normalized as explained in this article.
Finally, you should include as many Service Desks in your benchmarking peer group as possible. The larger the peer group of
valid benchmarking candidates, the more statistical validity you will have in your benchmark. Participation in large scale benchmarking syndicates of the sort sponsored by MetricNet is the best way to ensure a robust peer group for your benchmark.
Due to space limitations, this article barely begins to scratch the surface on the topic of benchmarking peer group selection. In subsequent articles, MetricNet will continue its series on Successful Benchmarking for the Service Desk, with articles on:
- The Benchmarking Performance Gap: Diagnosing the Causal Factors Behind
- Your Service Desk’s Performance Gaps
- The Cost vs. Quality Tradeoff: How Benchmarking Can Help You Achieve the Right Balance Between Cost and Quality in Your Service Desk Peer Group Selection for Service Desk Benchmarking
- The Benchmarking Payoff: How to Build a Hard-Hitting Action Plan From Your Service Desk Benchmark
Stay tuned for next month’s article!