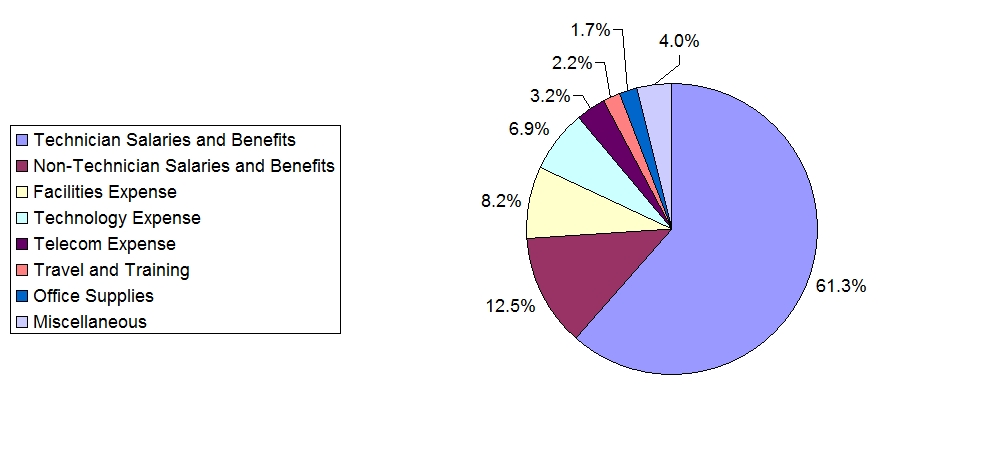
Figure 1: Expense Breakdown for Desktop Support
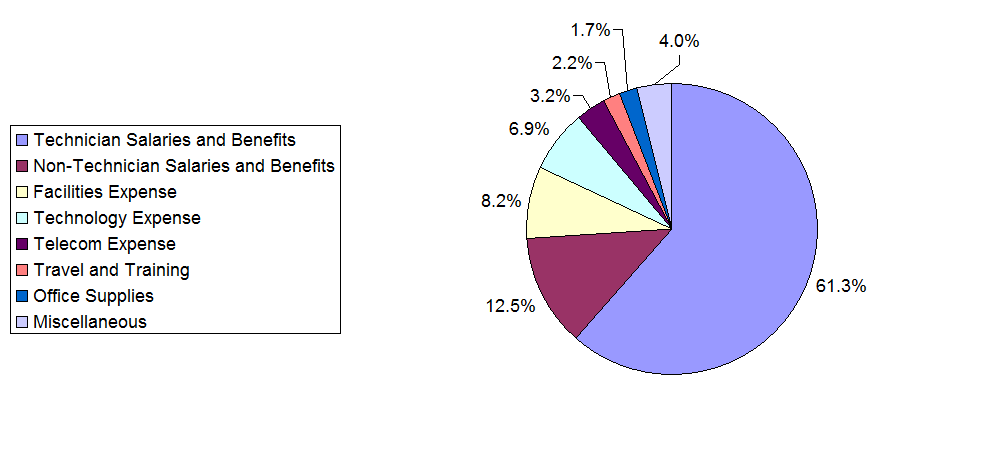
The best measure of labor productivity in desktop support is technician utilization. Because technician salaries and benefits represent more than 60% of all desktop support costs, if technician utilization is high, the cost per ticket will be correspondingly lower. Conversely, when technician utilization is low, technician costs, and hence cost per ticket, will be correspondingly higher. This is illustrated in Figure 2 below.
Figure 2: Technician Utilization vs. Cost per Ticket
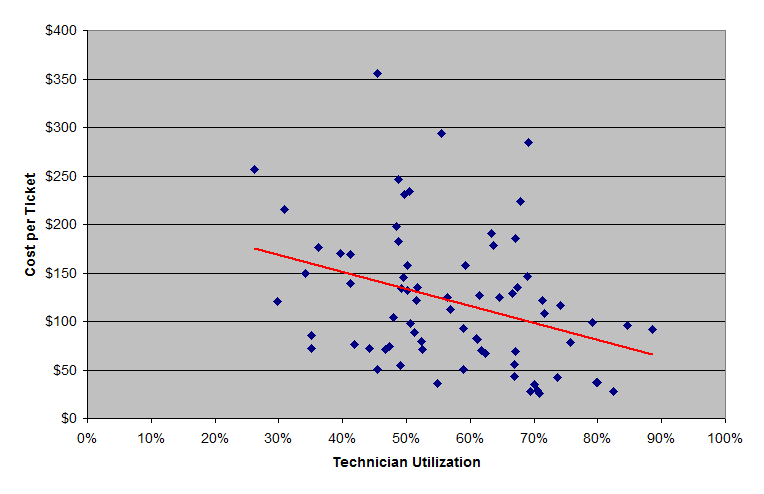
Just as world-class desktop support groups are obsessive about maintaining high customer satisfaction levels, they are equally committed to keeping their costs in check. They do this primarily by maintaining tight control over technician utilization. This has the effect of helping to minimize cost per ticket as illustrated above. Keep in mind, however, that other factors besides technician utilization will have an impact on the cost per ticket. Chief among these is the travel time per ticket, which can be quite high when supporting a customer base that is widely dispersed geographically.
The formula for determining technician utilization is somewhat complicated. It factors in the hours in a work day, break times, vacation and sick days, training time and a number of other factors. But there is an easy way to approximate technician utilization without going to so much trouble:

Let’s say, for example, that the technicians in a particular desktop support group handle an average of 60 incidents and 24 service requests per month. Let’s further assume that the average handle time for incidents is 32 minutes, and the average handle time for service requests is 59 minutes. Let’s also assume an average travel time per ticket of 41 minutes. Additionally, these technicians work an average of 21.5 days per month, and their work day is 7.5 hours after subtracting lunch and break times. The simplified utilization formula above would work out to the following:

Once again, this is not a perfect measure of technician utilization, but it is quick and easy, and gets you within 5% of the true technician utilization figure.
Benchmark Ranges for Technician Utilization
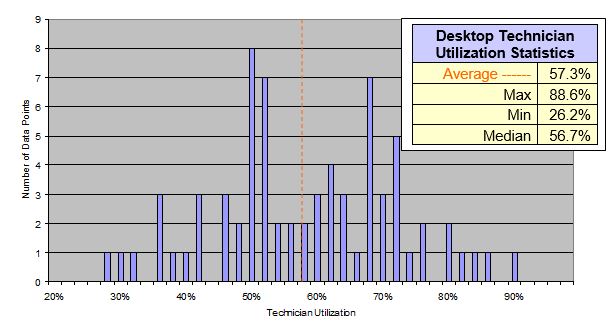
MetricNet’s benchmarking database shows that the average technician utilization for desktop support groups worldwide is about 57%. This number varies widely, however, from a low of 26% to a high of 89%. Those at the low end of this range tend to be smaller organizations that are unable to achieve economies of scale, or desktop support groups that must overstaff to meet very aggressive service levels for response time. Those at the high end of this range tend to be larger organizations that have good scale economies, and can schedule their desktop support technicians very efficiently.
Figure 3 below shows the distribution of technician utilization for a representative cross-section of desktop support groups worldwide.
Figure 3: Benchmarking Statistics for Desktop Support Technician Utilization
Please join us for next month’s
Metric of the Month:
The Desktop Support Balanced Scorecard, a straightforward approach for measuring overall performance for desktop support.