The Mighty Power of Metrics
Many of us have heard the sage advice “
You can’t manage what you don’t measure.” This is particularly true in the call center, where effective performance measurement is not just a necessity, but a prerequisite for effective decision-making. Despite the widespread belief in this statement, few call centers use KPIs to their full potential. In fact, MetricNet’s research, gathered from literally thousands of call center benchmarks, suggests that the vast majority of call centers use metrics to track and trend their performance – but nothing more! Unfortunately, in this mode, a call center misses the real value of performance measurement by failing to exploit the
diagnostic capabilities of KPIs.
The true potential of KPIs can only be unlocked when they are used holistically, not just to
measure performance, but also to:
- Track and trend performance over time
- Benchmark performance vs. industry peers
- Identify strengths and weaknesses in the call center
- Diagnose and understand the underlying drivers of performance gaps
- Prescribe actions to improve performance
- Establish performance goals for both individuals and the call center overall
In short, performance measurement and management is a critical discipline that must be mastered for any call center that aspires to world-class performance.
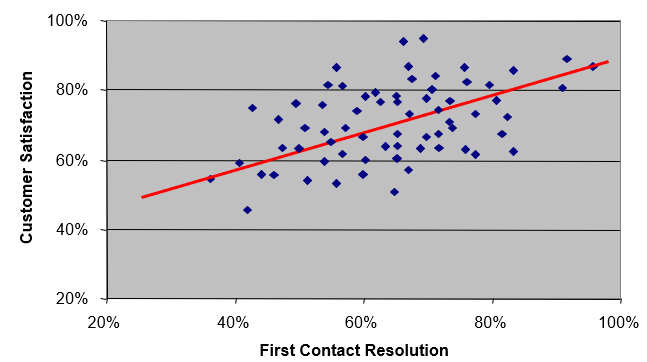
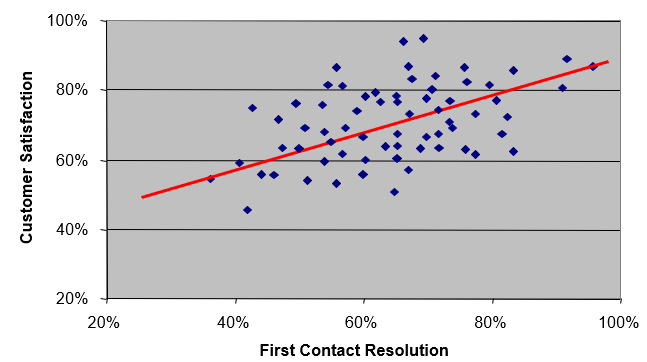
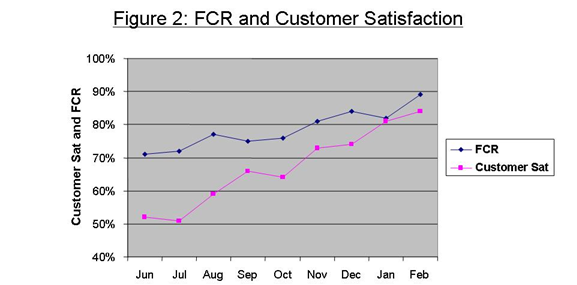
A simple example will serve to illustrate how this discipline is applied. MetricNet recently worked with a 500+ seat retail banking call center that was struggling with low levels of customer satisfaction. A quick benchmark of the KPIs showed that the bank’s First Contact Resolution (FCR) – the number of contacts resolved on initial contact with the customer – was low, at only 71%. Given the strong correlation between FCR and Customer Satisfaction (Figure 1 below), the bank initiated a number of initiatives designed to increase the FCR. These included more agent training hours, and the implementation of performance goals for FCR. As a result, over a period of eight months the bank realized a substantial increase in FCR, and hence customer satisfaction (Figure 2 on the next page).
Figure 1: FCR vs Customer Satisfaction
 The Five Most Important Call Center Metrics
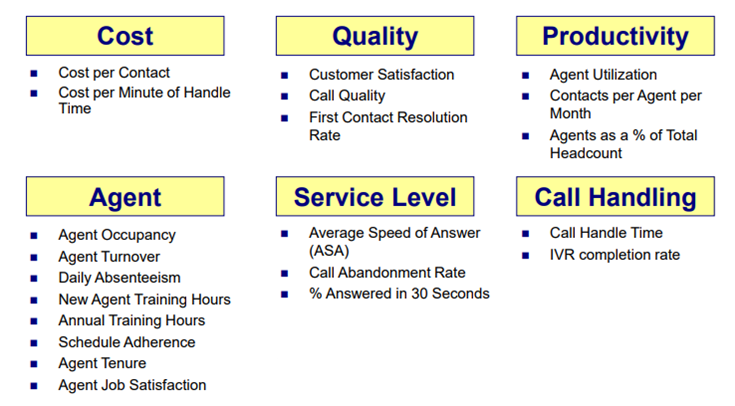
The average customer service call center tracks more than 25 metrics. A list of the most common metrics is shown below (Figure 3 on the next page). This is a classic example of quantity over quality, where call centers falsely assume that they are doing something productive and good by tracking all of these metrics. The vast majority of these metrics, however, are only marginally relevant – at best! The five that really matter are as follows:
- Cost per call
- Customer Satisfaction
- First Contact Resolution Rate
- Agent Utilization
- Aggregate Call Center Performance (Balanced Scorecard)
These five metrics represent the 80/20 rule when it comes to call center performance: 80% of the value you receive from performance measurement and management in your call center can be derived from these five simple metrics!
How do we know these are the most important metrics? Is it a hunch? Suspicion? An academic exercise? No, it’s none of the above. We know that these are the five metrics that matter most because the empirical evidence from more than a thousand call center benchmarks supports this conclusion. But let us explain
why these metrics are so critically important.
Figure 3: Common Call Center Metrics
One goal of every business is to achieve the highest possible quality at the lowest possible cost. It stands to reason, therefore, that cost and quality should be measured on an ongoing basis. In fact, many would argue that cost and quality are the only two things that really matter. In a call center, the most effective cost metric is cost per contact, and the best indicator of quality is customer satisfaction. With this premise in mind, it’s relatively easy to come up with the next two metrics on our list: First Contact Resolution (FCR), and Agent Utilization.
Earlier in this article, we talked about the importance of using metrics as a diagnostic tool to improve performance. So, we have to ask ourselves, if customer satisfaction is one of the “foundation metrics” in the call center, how can we affect it? How can we improve it? Put another way, if customer satisfaction is suffering, what is the diagnosis?
Well, it turns out that customer satisfaction is affected by a whole range of other performance variables, including Average Speed of Answer (ASA), Call Quality, and Handle Time, to name just a few. But the single biggest driver of customer satisfaction – by far – is FCR! The strong correlation between these two metrics was illustrated earlier in Figure 1. Nine times out of ten when customer satisfaction needs to improve, this can be achieved by increasing the FCR. This is why world-class call centers pay so much attention to this metric. They engage in a variety of tactics to continuously improve FCR, including agent training, investments in knowledge bases, and agent incentives tied to improvements in FCR.
But what about Cost per Call, the other foundation metric in the call center? It is common knowledge that labor, i.e. personnel, is the single biggest expense in the call center. In fact, for the average call center, 67% of all costs are labor related: salaries, benefits, incentive pay, and contractors. By definition then, labor costs are the greatest lever we have to reduce the cost per call.
The best measure of labor efficiency is agent utilization. Because labor costs represent the overwhelming majority of call center expenses, if agent utilization is high, the cost per call will inevitably be low. Conversely, when agent utilization is low, labor costs, and hence cost per call, will be high. This is illustrated in Figure 4 below.
Figure 4: Agent Utilization vs. Cost per Contact
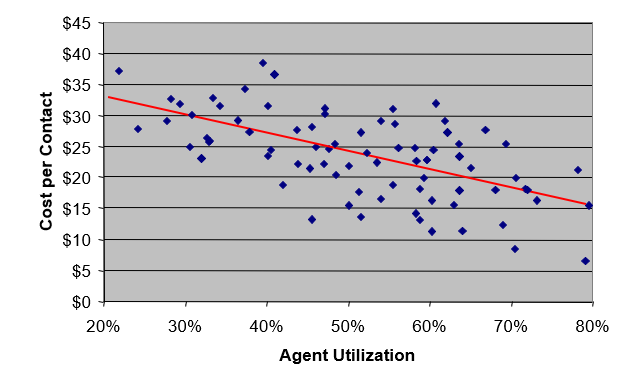
Just as world-class call centers are obsessive about maintaining a high FCR, they are equally committed to keeping their agent utilization rates high. This, in turn, has the effect of minimizing cost per call as illustrated above. That said, high utilization rates, taken to the extreme, can actually increase your costs by driving agent turnover rates higher. Whenever utilization numbers approach 70% - 80%, that call center will see relatively high agent turnover rates because they are pushing the agents too hard. Extremely high utilization leads to burnout, and that, in turn, leads to turnover.
Turnover is one of the most costly things that a call center can experience. In order to proactively manage agent turnover, best-in-class contact centers focus on “career pathing,” training, and time off phones to work on projects. The more time spent off the phones, the more training agents receive, and the more career coaching they have, the lower the turnover will be. This has to be leavened, of course, with the need to keep agents productive on the phones.
The formula for determining agent utilization is somewhat complicated. It factors in the length of the work day, break times, vacation and sick time, training time and a number of other factors. But there is an easy way to approximate agent utilization without going to all this trouble:

Let’s say, for example that the agents in a particular call center handle an average of 1,250 calls per month at an average handle time of 5 minutes. Additionally, these agents work an average of 21 days per month, and their work day is 7.5 hours after subtracting lunch and break times. The simplified utilization formula above would work out to the following:

Once again, this is not a perfect measure of agent utilization, but it is quick and easy, and gets you within 5% of the true agent utilization figure.
We have now discussed four of the five metrics that are most important for managing a call center. What about the fifth metric? What is aggregate call center performance, and how do we measure it? Can a single measure really tell us the overall performance of our call center? The answer is yes, but as the name suggests, it involves aggregating a number of measures to come up with a combined score for call center performance.
MetricNet’s research shows that establishing a single, overall score for your call center is critical. We call this measure the Balanced Score because it truly does communicate a balanced picture of call center performance. This is a mechanism that utilizes the key measures tracked in a call center, including such things as cost per call, ASA and call abandonment rate, and rolls them into a single, aggregate measure of call center performance.
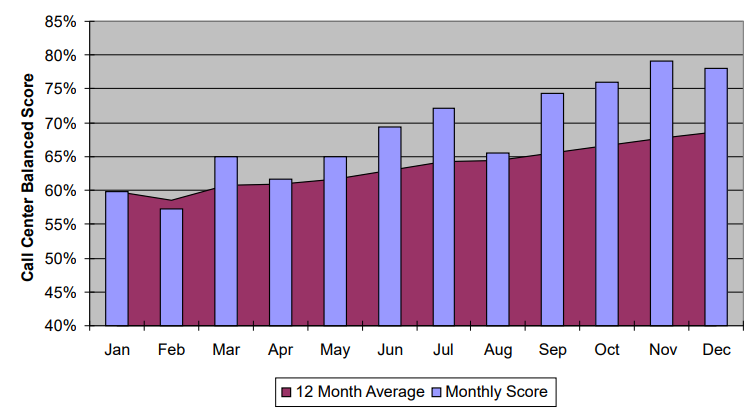
The value of this metric, when tracked over time, is that it enables call centers to determine whether overall performance is improving or declining. Oftentimes, when a call center attempts to communicate its performance to other stakeholders in the business, particularly to lay people who do not understand call center operations, they quickly become overwhelmed by the minutia of such measures as speed-of-answer and abandonment rate, and they are confused about how to interpret the results. They are likely to focus in on one, easily-understood metric like abandonment rate or speed of answer, and draw conclusions about overall call center performance from these two (relatively unimportant) measures. This is a classic case of “missing the forest for the trees”. It is therefore absolutely critical to communicate the overall performance of the call center, and the Balanced Score does that for you. It allows the aggregation of the most important KPIs, the normalization of those metrics, and the creation a single all-encompassing indicator of call center performance on a monthly basis. In this way, the call center can track its overall performance, and, in any given month, may see costs go up or customer satisfaction go down or speed of answer increase, but these individual measures take on a secondary level of importance because the Balanced Score provides a more complete and accurate portrait of call center performance.
Figure 5 below illustrates how the Balanced Score is calculated.
Figure 5: The Call Center Balanced Scorecard
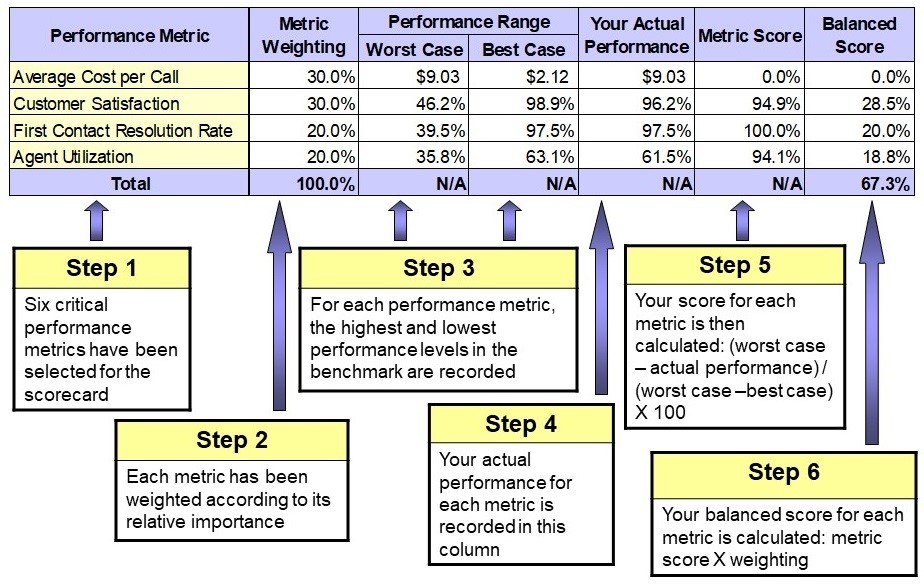
Figure 6 below illustrates the Balanced Score for one call center over a twelve-month period. Notice how you can see at a glance which months had improving performance (the balanced score goes up), and which months had declining performance (the balanced score goes down). The good news for this call center is that the overall trend is in a positive direction!
Figure 6: Trending the Balanced Score
 Metrics that Don’t Matter (as much)
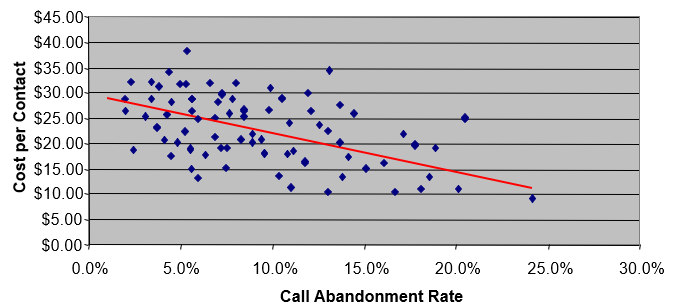
Some of the most commonly tracked metrics in the call center, including ASA and Call Abandonment Rate, did not make the cut of the top five. Why is this? Have we missed something? Why are ASA and Call Abandonment Rate, which are so widely followed in this industry, not included in the top five? The answer is simple…they just don’t matter! That’s right; these metrics which are the foundation of so many service level agreements have almost no impact on customer satisfaction. Worse yet, as these metrics are pushed lower (i.e., lower ASA and lower Call Abandonment Rates) the cost per call increases geometrically! These facts fly in the face of almost all call center wisdom, which holds that ASA and Call Abandonment Rate should be driven as low as possible.
If nothing else, in this paper we hope to shatter the myth that ASA and Call Abandonment Rate are important metrics. The reality is that these measures can yield unintended results if pushed too low. They will increase your costs without any corresponding increase in customer satisfaction. In the next section of this article, we will provide some guidelines for appropriate ASA and Call Abandonment Rate targets. And, as you probably suspect, they are higher than you might think.
As we stated earlier in this article, these conclusions are based on empirical evidence. Figures 7, 8, 9, and 10 below show how little these two metrics affect customer satisfaction, yet how much they can increase your costs if driven too low.
Figure 7: ASA vs. Customer Satisfaction
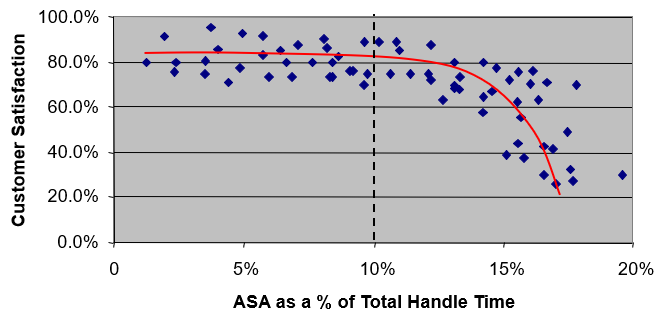
Figure 8: ASA vs. Cost per Contact
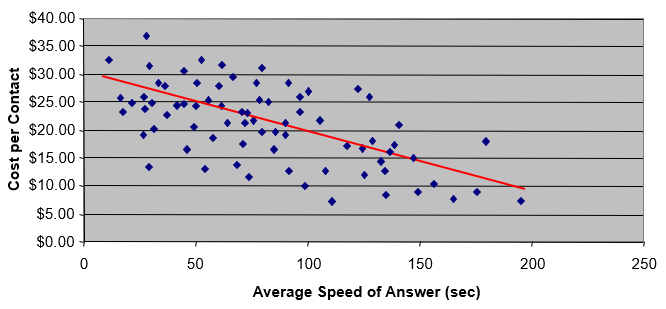
Figure 9: Abandonment Rate vs. Customer Satisfaction
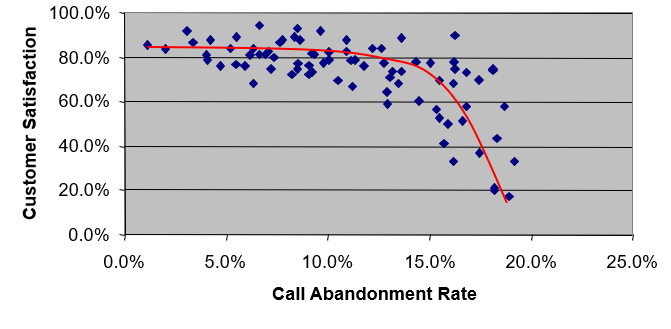
Figure 10: Abandonment Rate vs Cost per Contact
Please keep in mind that ASA and Call Abandonment Rate are not the only “low value” metrics tracked by many call centers. Figure 3 above shows 25+ of the most common metrics tracked by call centers, and the vast majority of these metrics fall into the same category as ASA and Call Abandonment: they add little if any value. Again, if you keep in mind the 80/20 rule of call center performance measurement, and focus on the five metrics identified in the previous section, you can operate your call center very efficiently and effectively.
Benchmark Performance Ranges
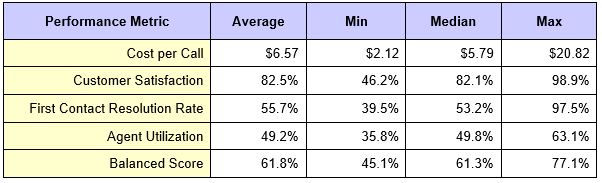
As a company that provides online benchmarks to companies worldwide, and across all major industries, MetricNet relies extensively on benchmarking to establish performance goals and targets for its call center clients. For the five most important call center metrics, Figure 11 below provides a number of valuable benchmarks that may be useful in establishing performance targets for your call center.
Figure 11: Benchmarks for Top 5 KPIs
 Conclusion
Most call centers commit two major mistakes when it comes to performance measurement: 1) they track too many metrics, and 2) they do not exploit the full potential of their performance metrics as a diagnostic tool.
In this article we have shown that you can effectively track and trend your call center performance using just five KPIs. The two “foundation metrics” that every call center should track on an ongoing basis are Cost per Call and Customer Satisfaction. The next two metrics in the top five are the ones that have the greatest influence on cost and customer satisfaction: Agent Utilization and First Contact Resolution. And the final metric, what we call an aggregate metric because it provides an overall measure of call center performance, is the Balanced Score.
These five metrics not only allow you to effectively measure your call center performance, but they enable you to:
- Track and trend performance over time
- Benchmark performance vs. industry peers
- Identify strengths and weaknesses in the call center
- Diagnose and understand the underlying drivers of performance gaps
- Prescribe actions to improve performance
- Establish performance goals for both individuals, and the call center overall
When it comes to call center measurement and management, less really is more! By tracking just five KPIs, and using these KPIs diagnostically to affect positive change in the call center, the job of guiding your call center towards world-class performance can be greatly simplified.
About the Author
Jeff Rumburg is a co-founder and Managing Partner of MetricNet, where he is responsible for global strategy, product development, and financial operations for the company. As a leading expert in benchmarking and re-engineering, Mr. Rumburg authored a best selling book on benchmarking, and has been retained as a benchmarking expert by such well known companies as American Express, Hewlett-Packard, General Motors, IBM, and Sony.
Mr. Rumburg received the Ron Muns Lifetime Achievement Award for his contributions to the IT Service and Support industry. Prior to co-founding MetricNet, Mr. Rumburg was president and founder of The Verity Group, an international management consulting firm specializing in call center benchmarking. While at Verity, Mr. Rumburg launched a number of syndicated benchmarking services that provided low cost benchmarks to more than 1,000 corporations worldwide. Mr. Rumburg has also held a number of executive positions at META Group, and Gartner. As a vice president at Gartner, Mr. Rumburg led a project team that reengineered Gartner’s global benchmarking product suite. And as vice president at META Group, Mr. Rumburg’s career was focused on call center benchmarking.
Mr. Rumburg’s education includes an M.B.A. from the Harvard Business School, an M.S. magna cum laude in Operations Research from Stanford University, and a B.S. magna cum laude in Mechanical Engineering. He is author of
A Hands-On Guide to Competitive Benchmarking: The Path to Continuous Quality and Productivity Improvement, and has taught graduate-level engineering and business courses.
For More Information
For more information on MetricNet, go to
www.metricnet.com, e-mail us at
[email protected], or call us at 775-298-7772.