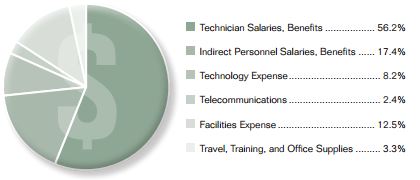
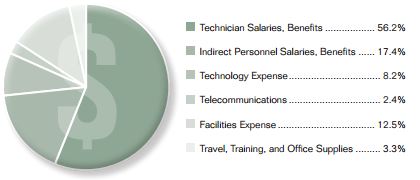
Figure 1 shows the average breakdown of direct costs for North American desktop support organizations in 2009. As you might expect, the vast majority of direct costs for desktop support are personnel-related.
Figure 1: The Direct Cost of Desktop Support
The direct cost of desktop support gives us the pure “accounting cost” of the function. However, the unit cost of desktop support is a more useful metric, particularly when comparing or benchmarking the cost of desktop support against industry averages or other organizations. In my previous article, “Best Practices in Desktop Support: The Eight Essential KPIs for World-Class Performance,” I made a distinction between desktop support tickets, incidents, and service requests, where tickets are the sum of all incidents and service requests. Just as cost per contact gives us the unit cost for the level 1 service desk, cost per ticket, cost per incident, and cost per service request give us the unit costs for desktop support. Table 1 illustrates the North American averages and ranges for these cost metrics.
Table 1: North American Desktop Support Costs (2009)
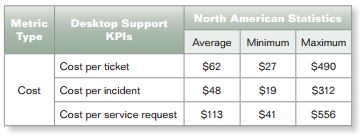
Each of these cost metrics vary by more than an order of magnitude (10x) from minimum to maximum. Herein lie important clues about other factors driving the true cost of desktop support, specifically, the cost of defects and workload drivers. Let’s take a closer look at each of these cost drivers.
The Cost of Defects
One of the eight essential KPI’s for desktop support is the % Resolved Level 1 Capable. This metric is a proxy for Total Cost of Ownership (TCO), and is a critical measure of overall End-User Support effectiveness. It is also a measure of defects since every ticket resolved at desktop support that could have been resolved at level 1 incurs substantial additional support costs.
At an average cost per ticket of $22 for the level 1 service desk, and an average cost per ticket of $62 for desktop support, each ticket that is escalated to desktop support that could have been resolved by the service desk generates $62 in wasted expense! The sad truth is that more than 20% of all tickets resolved by desktop support fall into this defect category: they could have been resolved at level 1!
Defects are not only a function of tickets that are escalated unnecessarily from the service desk. They are also the result of sloppy practices by desktop support organizations that do now follow a strict SPOC model for end-user support. We have all heard the terms “drive bys”, “fly bys”, and “snags” in reference to a desktop support technician being grabbed without warning, and asked to resolve a computer issue on the spot. The vast majority of these drive bys should be resolved remotely, by the service desk. But by giving in to the demands of the user, the desktop support technician is violating the SPOC support model, and incurring significant additional support costs for the organization. Strict enforcement of the SPOC model would have the desktop support technician tell the user to start by contacting the level 1 service desk to report any computer-related issues.
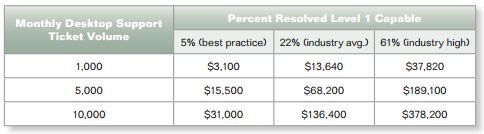
Table 2 illustrates the severity of this problem (i.e., how much these defects can cost an organization). Even at a best-practice rate of 5 percent resolved level 1 capable, an organization handling 5,000 desktop support tickets per month is incurring defect costs of $15,500 per month. That’s $186,000 per year!
Table 2: The Cost of Desktop Support Defects (2009)
Workload Drivers
The final factor that drives the true cost of desktop support is workload. While this may seem obvious, what is not so obvious is how dramatically workload can vary from one company to another, even for organizations that are supporting the same number of users! The list below identifies some of the myriad factors that affect the workload for desktop support.
- Device count and mix
- Mix of desktop and laptop computers
- Mix of service requests and incidents
- Number of mobile devices
- Average age of devices
- Managed/virtualized desktops
- User population density (high-rise, campus, field)
- User work location (office, home, field)
- And many more!
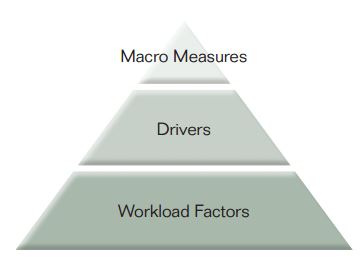 As this list demonstrates, workload is driven by numerous factors that are beyond the control of desktop support. This is part of the reason why the number of tickets, incidents, and service requests can vary so dramatically from one organization to another. Table 3 shows the wide variation in workload volume, measured by tickets, incidents, and service requests per seat per month.
Table 3: Desktop Support Workload Statistics
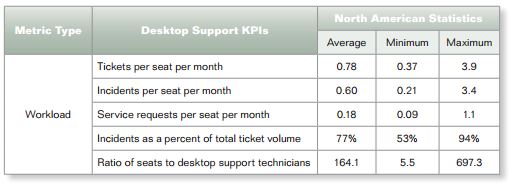 One important conclusion we can draw from these workload drivers is that desktop support organizations should not be staffed based upon the industry average ratio of users (or seats) to desktop support technicians. Depending upon workload, the ratio of seats supported to desktop support technicians could be as high as 697:1 (i.e., one desktop support technician for every 697 seats) or as low as 5.5:1 (i.e., one desktop support technician for every 5.5 seats). Staffing decisions should be based on workload—incident and service request volume.
Although workload drivers are often beyond desktop support’s direct control, some of them can, in fact, be controlled by other groups or managers within IT, including such things as the average age of the devices being supported (related to the device refresh rate) and the degree of standardization and virtualization of the desktop. As a rule, organizations with a standardized desktop environment (e.g., a limited number of standard images, lockdown safeguards, etc.) will generate far fewer tickets per user, and, therefore, have lower desktop support costs. Likewise, a managed/virtualized desktop has been proven to lower the costs of desktop support, sometimes significantly. These controllable workload factors, and the cost savings that are possible in a well-managed desktop environment, are sometimes enough to justify funding for desktop virtualization and enterprise-wide device refresh projects.
An example of a noncontrollable workload factor would be user population density. Desktop support technicians working in a high-density user environment (e.g., a high-rise office building with lots of cubicles) will be able to handle a larger volume of tickets per month than a technician supporting numerous small work environments that are spread across a large geographical area (e.g., a retail bank with hundreds of branches across the country). Likewise, the mix of incidents and service requests is largely noncontrollable, but it has a dramatic impact on work time per ticket, staffing, and, therefore, cost.
Let’s assume, for example, that at ABC, Inc., the cost per incident is $50, while the cost per service request is $100. In addition, 75 percent of ABC’s tickets are incidents, while the remaining 25 percent are service requests. The cost per ticket can be calculated (based upon a weighted average) as follows:
($50 × .75) + ($100 × .25) = $62.50
Now, consider XYZ, Inc., which has the same cost per incident and cost per service request as ABC, Inc., but a different ratio of incidents to service requests. At XYZ, only 40 percent of tickets are incidents, while the remaining 60 percent are service requests. XYZ’s cost per ticket works out to:
($50 × .40) + ($100 × .60) = $80.0
So, although ABC and XYZ have the exact same cost per incident and cost per service request, their unique ratios of incidents to service requests yields very different costs per ticket. If both organizations were to handle 5,000 tickets per month, XYZ would spend $87,500 more per month on desktop support than ABC, simply because a greater percentage of their tickets are service requests.
Controlling the Costs of Desktop Support
The obvious question now is: What can be done to control and minimize the cost of desktop support? There are two options:
1.The desktop support organization can take steps to minimize the number of defects.
2.IT management can take steps to minimize the number of tickets generated.
As I’ve mentioned, the primary KPI for tracking defects is percent resolved level 1 capable. The first step in reducing defects is simply to track this metric. This can be done by creating a box on the trouble ticket that a desktop support technician can check when closing a ticket that could have been resolved by the service desk. Alternatively, some companies sample a number of tickets closed by desktop support each month and estimate the defect rate by dividing the number of tickets that could have been resolved by the service desk by the total number of tickets sampled. By tracking this metric, enforcing a strict SPOC model, and eliminating drive bys, desktop support has the power to greatly reduce defects and lower the cost of desktop support—indeed, the total cost of ownership—for end-user support.
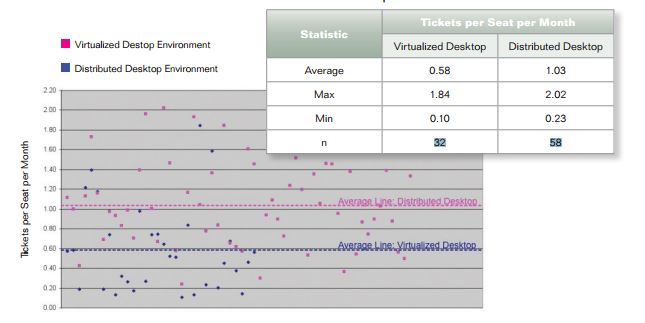
Likewise, IT management is obligated to implement actions that will reduce the number of desktop support tickets, and, thus, the total cost of desktop support. The primary strategies that accomplish these objectives include standardizing the desktop image and virtualizing the desktop environment. Figure 2 illustrates how the total cost of desktop support is substantially lower in a virtualized desktop environment versus the traditional, distributed desktop environment
Figure 2: Ticket Volume in Virtualized vs. Traditional Desktop Environments
Conclusions
The true cost of desktop support is much greater than most companies realize. It goes well beyond the obvious costs of personnel, technology, and facilities. A full reckoning of desktop support costs must include the cost of defects – tickets resolved at desktop support that could have been resolved at level 1 – as well as costs that result from the IT environment itself. These environmental factors include the mix of incidents and service requests, the user population density, the number of mobile devices, and the standardization of the desktop.
The benefit of understanding the true cost of desktop support is that processes and practices can be adopted that will serve to contain, reduce, and minimize the cost of desktop support. These include tracking and minimizing desktop support defects, following a strict SPOC support model, and standardizing and virtualizing the desktop.
You can register for MetricNet's free webcast on Desktop Support Best Practices by visiting our
webcast page.
MetricNet conducts Desktop Support Benchmarking for organizations worldwide. For more information, please visit our
benchmarking store, or
contact MetricNet.