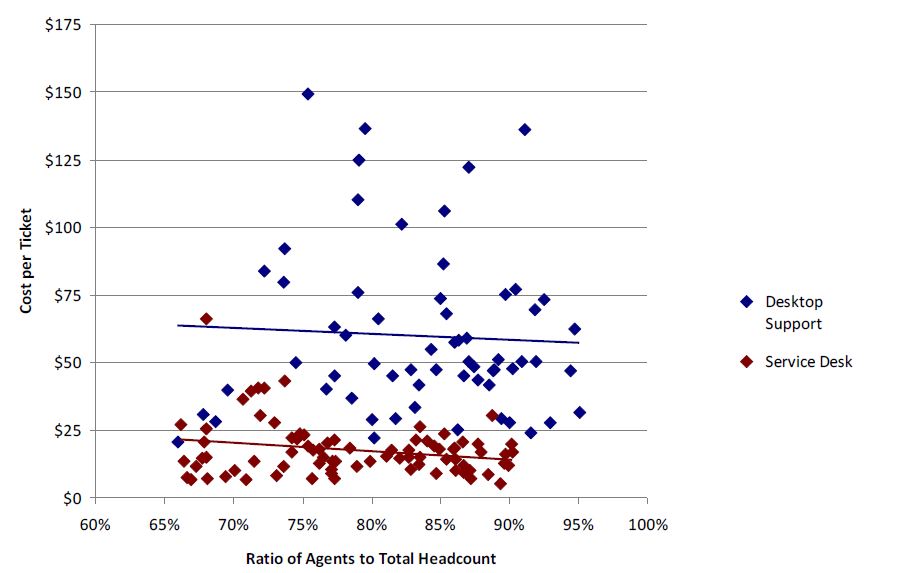
There are a number of ways to measure the efficiency of a service desk or desktop support group. Metrics such as cost per ticket and agent utilization are the most common measures of efficiency. But there is another, less well known metric that also drives cost per ticket. That metric is the ratio of agents to total headcount, and it applies equally to both service desk and desktop support groups.
By way of example, let’s assume that a service desk has 25 front-line agents, 3 supervisors, 1 QA/QC person, and 1 person for training and workforce scheduling. That’s a total headcount of 30. In this example, the ratio of agents to total headcount is 25 ÷ 30 = 83.3%. The same calculation would apply for a desktop support group.
The ratio of agents to total headcount is an indirect measure of managerial efficiency in service and support. A high ratio of agents to total headcount is indicative of lean management staffing, while a low ratio of agents to total headcount is symptomatic of a top-heavy organization. It is, however, possible for the ratio to be too high, in which case the support organization may lack adequate headcount for proper supervision and other indirect functions such as reporting, workforce scheduling, and training. Conversely, there are times when a low ratio of agents to total headcount may be justified, at least temporarily, such as when a support group moves agents out of customer facing roles to work on and contribute to various projects.
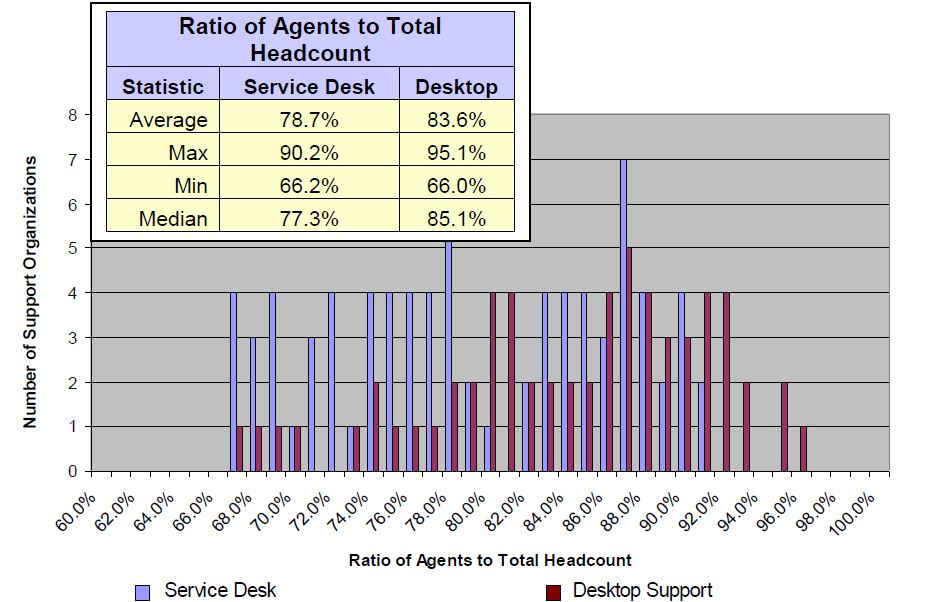
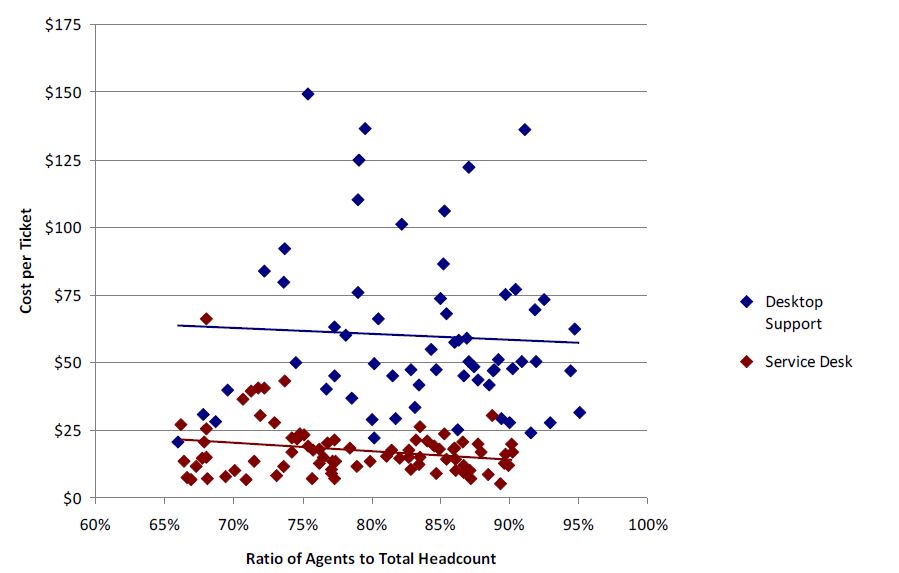 Figure 2 below shows the distribution of agents to total headcount for both the service desk and desktop support, along with summary statistics for both metrics. The ratio of agents to total headcount can vary quite widely, from 66% to 90% for the service desk, and from 66% to 95% for desktop support. The average ratio of agents to total headcount tends to be a bit higher for desktop support than for the service desk. This reflects the fact that supervision, reporting, training and scheduling in desktop support is oftentimes less rigorous than in the service desk.