The first source of value derives from the ability of support to minimize total cost of ownership (TCO) through shift left. Last year in North America, the average fully loaded cost per ticket was $22 for the service desk, $69 for desktop support, and $104 for level 3 IT support, as shown in the figure below. The well-known industry expression “Get it done at level 1” is not just a pithy catchphrase. It can literally save your organization millions of dollars a year!
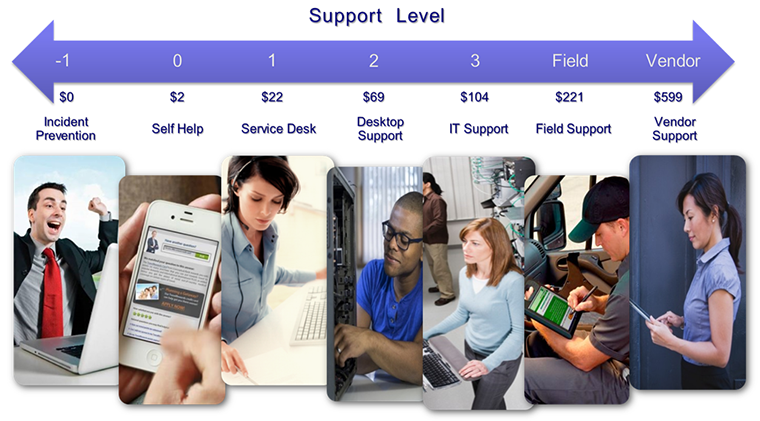
Recent benchmarks show that 21% of all tickets resolved by desktop support could have, and should have, been resolved by the level 1 service desk. These escalation errors represent defects in the support process and result in increased support costs that often go unnoticed because they are rarely tracked. By investing in tools, training, and technology that drive higher resolution rates at level 1, you have the potential to significantly reduce the TCO for IT support.
Channel mix at level 1 is rapidly evolving as shown in the figure below and is considered one of the industry’s megatrends. In 2007, voice calls represented almost 80% of all ticket volume. Today, voice accounts for less than 50% of incoming ticket volume.
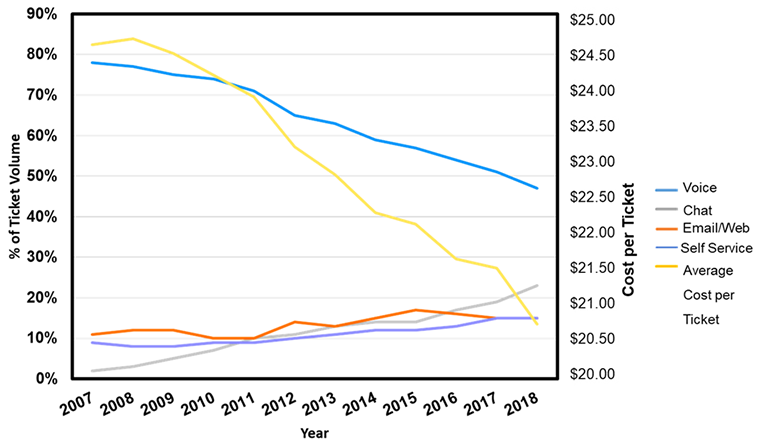
There are two key drivers behind this trend. One is economic, and the second is demographic. The key economic driver is that voice, which has dominated the industry for decades, is one of the most expensive channels, while chat, email, web, and especially self-help (discussed in a prior Metric of the Month) are all lower cost than voice.
Self-help tickets are lower cost than voice for obvious reasons. But it’s not so obvious why chat, email, and web submitted tickets are lower cost than voice. Since voice is a real-time channel, the Erlang distribution of incoming calls tends to be very spiky. This, in turn, makes it challenging to staff the voice channel efficiently. The voice channel is perpetually either understaffed or over-staffed! Chat is also a real-time channel, but an effective chat agent can often handle two or more concurrent sessions, thereby making chat more efficient than voice. In fact, MetricNet’s benchmarking data shows that the average ticket resolved in chat costs just 76% as much as a ticket resolved in the voice channel.
Email and web submitted tickets tend to be lower cost than voice because these channels do not have quite the same real-time urgency as voice, and they are therefore less spiky than voice and chat. This makes it easier to staff the email and web channels, which leads to better agent utilization and lower costs. On average, the cost of an email or web-submitted ticket is about 81% of the cost of a voice-resolved ticket.
What about the demographic drivers behind channel mix? If you look at a spectrum of IT users —from those who are newest to the workforce, to those nearing retirement—younger users tend to prefer self-help or the indirect channels of chat and web submitted tickets, while those who have been in the workforce for some time lean much more heavily on live voice as their go-to channel for support. This trend, of course, will continue, as newer workers continue to enter the workforce.
The third key source of value creation and ROI is the result of returning productive hours to the workforce. The majority of today’s workforce is comprised of knowledge workers, all of whom rely upon one or more computing devices to do their jobs. When these devices break down or do not function properly, employee productivity suffers. By preventing these incidents from occurring, and by quickly resolving issues when they do occur, a support organization can return productive hours to the workforce.
A study conducted by MetricNet and summarized in the figure below concluded that knowledge workers lose an average of 33 hours of productive time per year due to various IT outages, breakdowns, and hardware and software failures. For support groups performing in the top quartile, the lost productivity per worker is just 17 hours per year—about half the industry average. By contrast, employees who receive support from bottom quartile support groups lose an average of 47 productive hours per year.
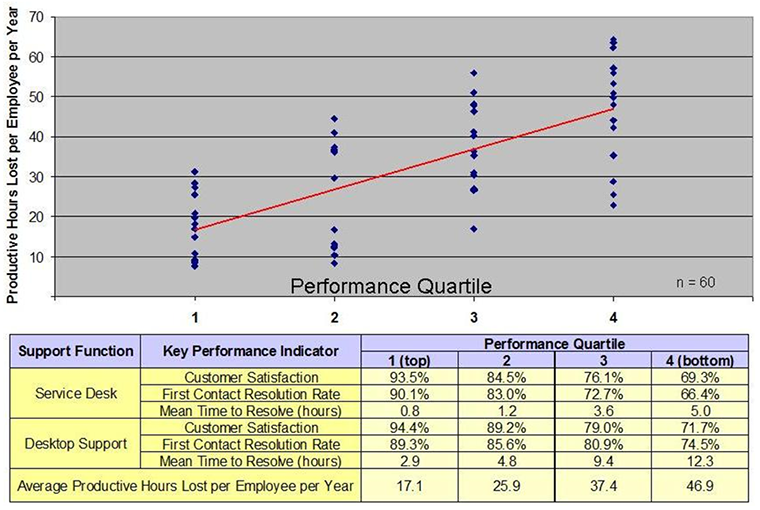
The difference between the top and bottom quartile performers is a staggering 30 hours per employee per year! Put another way, support organizations in the top quartile are able to return nearly four extra days of productivity annually for every knowledge worker in the enterprise. When multiplied by thousands or even tens of thousands of employees in a company, the productivity gains and ROI delivered by a top performing support group can be enormous!
Now that you understand how value (the return in ROI) is created in IT service and support, the next step is to apply this knowledge to calculate the ROI of your support organization. Please join me for next month’s Metric of the Month: ROI of Support, Part 2, where I will present a case study that demonstrates how to calculate the ROI of support.